Streaming IoT Telemetry to Azure Event Hub:Part 3
This blog post is a continuation of Streaming IoT Telemetry to Azure Event Hub:Part 2. This is the link to part 1 of the series.
The IoT Gateway
Making reference to the project flow one last time, 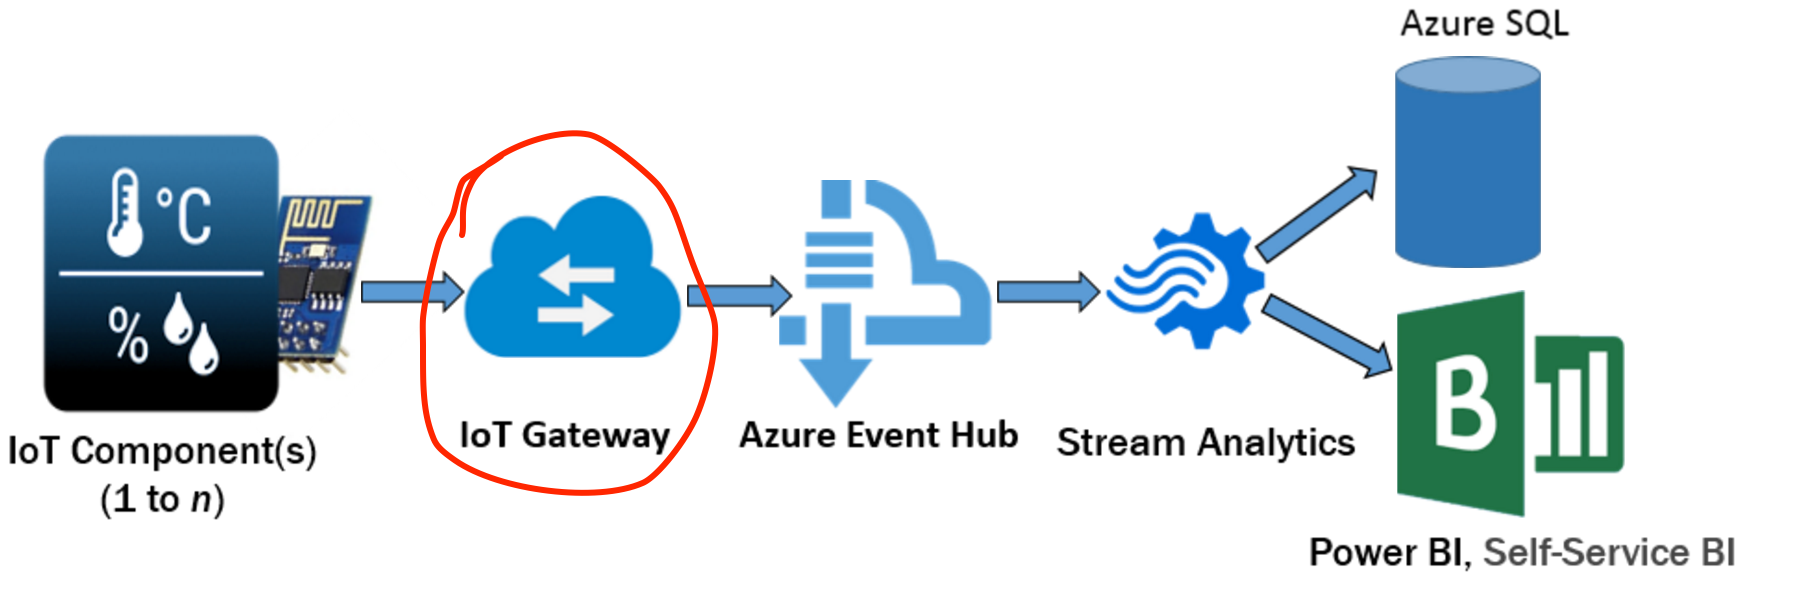
The implementation of the IOT Gateway is based on the Azure Event Hubs REST API's "Send Event" endpoint.
The endpoint is in this format:
https://{serviceNamespace}.servicebus.windows.net/{eventHubPath}/publishers/{deviceName}/messages
In my case:
https://ioteh-ns.servicebus.windows.net/ioteh/publishers/dhtxx/messages
The deviseName (dhtxx) can literally be anything, it can't be left null though.
Further, the send event endpoint accepts JSON-encoded string. The POST request should have the following headers:
- Timeout : This can be set to 2 sec or 3 sec - depending on what works best for you
- Content-Type : application/json
- Authorization : The generated SharedAccessSignature token value.
Generating Event Hubs SharedAccessSignature
If you recall from the previous blog, we created a Shared Access policy called DHTsender in the Event Hub configuration tab:
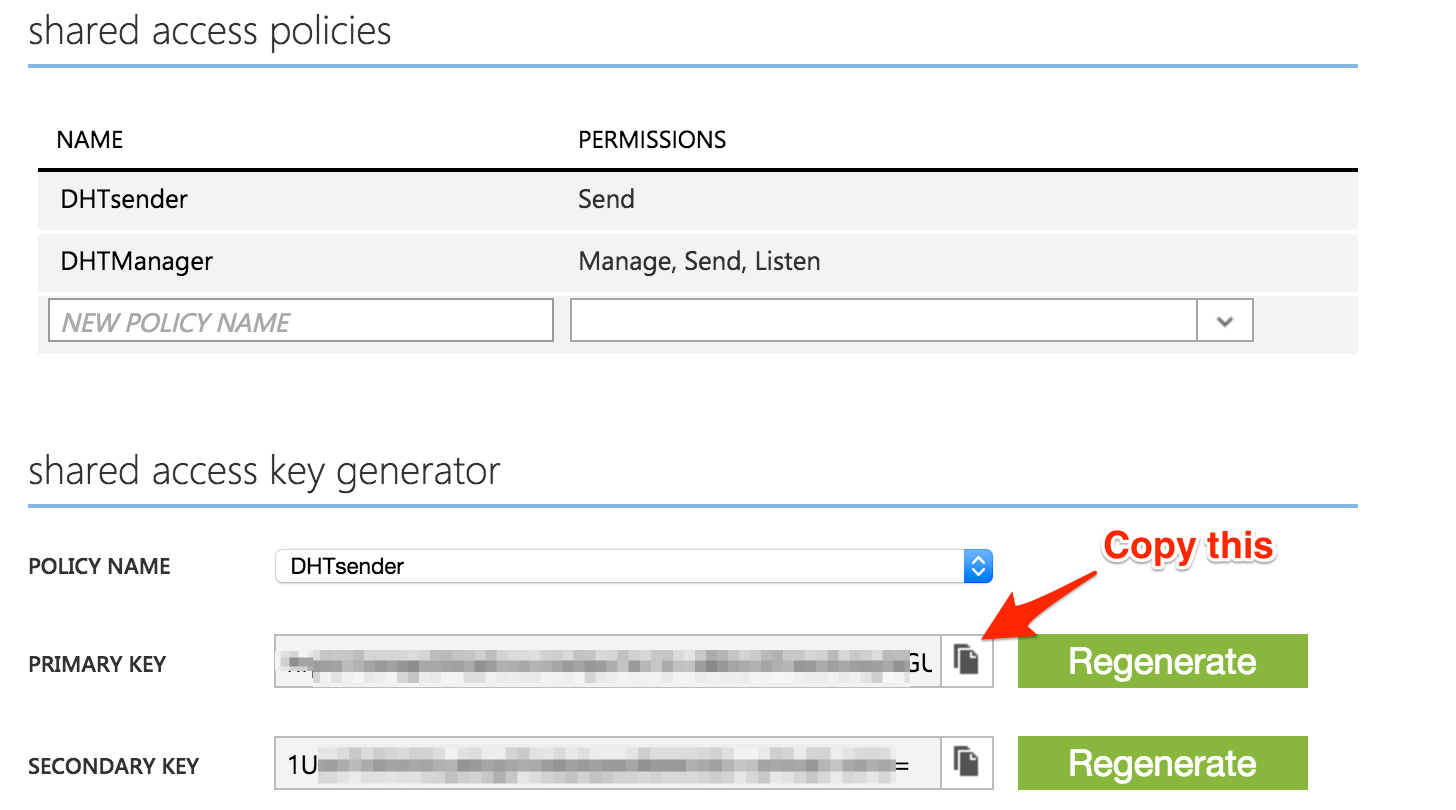
Copy the key to somewhere safe.
Next,download Sandrino's RedDog Signature Generator, then follow the steps to generate a SharedAccessSignature signature:
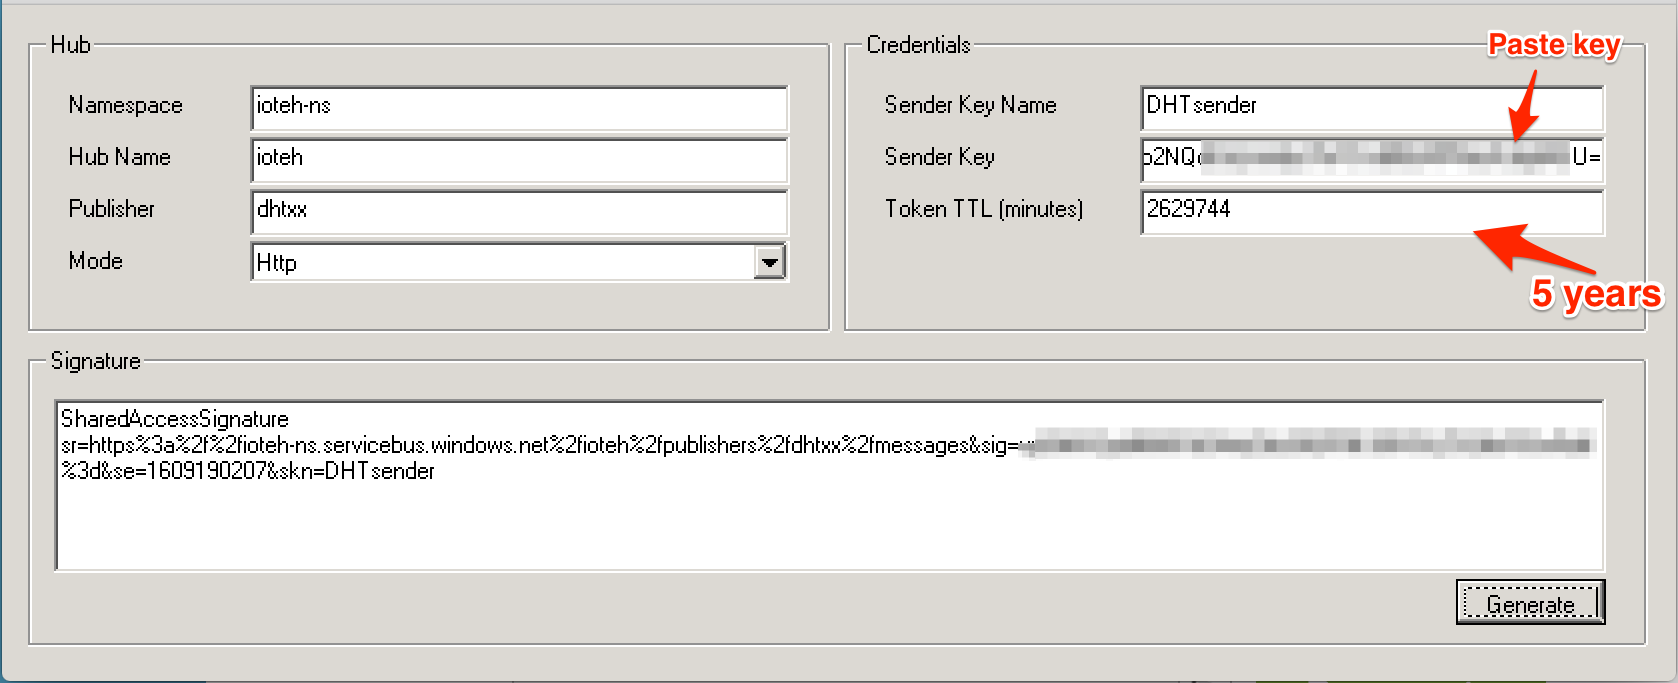
I used 5 years TTL because I don't want to regenerate this signature any time sooner; your mileage may differ.
The Implementation
First, this is the pseudocode so you can easily translate it to any programming language of choice:
 // main method
int send_event () {
SERVICE_NAMESPACE = 'ioteh-ns'
EVENT_HUB_NAME = 'ioteh'
PUBLISHER_NAME = 'dhtxx'
EVENT_HUB_SIGNATURE = 'change_me'
API_ENDPOINT = "https://#{SERVICE_NAMESPACE}.servicebus.windows.net/#{EVENT_HUB_NAME}/publishers/#{PUBLISHER_NAME}/messages"

// define headers
HTTP.Headers.ConnectionTimeout = 60
HTTP.Headers.Content-Type =  'application/json'
HTTP.Headers.Authorization = #{EVENT_HUB_SIGNATURE}

//body of message
HTTP.body = telemetry_data
//Send it
HTTP.POST (API_ENDPOINT)

If HTTP.RESPONSE.StatusCode == 201
// successfully sent event to Azure Event Hubs
Else
// print HTTP.RESPONSE.StatusCode
// print HTTP.RESPONSE.Body
return HTTP.RESPONSE.StatusCode
}

// method
String telemetry_data() {
//this method receives telemetry  data from IOT
// you will need to convert telemetry to json if you're not sending it in json format from IoT
// sample data: https://gist.github.com/iogbole/8af14091e801d6352cf2

return telemetry_json_format
}
I did my implementation in ruby on rails. This is the GitHub repo and the main classes are azure_envent_hub_service.rb and dhts_controller.rb respectively.
Deploying the IoT Gateway
I deployed the rails app to a CentOS server running on Azure VM. I opened up port 3000 (because I reserved port 80 for something else). To address the HTTP ONLY security concern, I configured ACL to only permit traffic from my home network IP address, that way no one outside my home network can read/send garbage from/to my application.
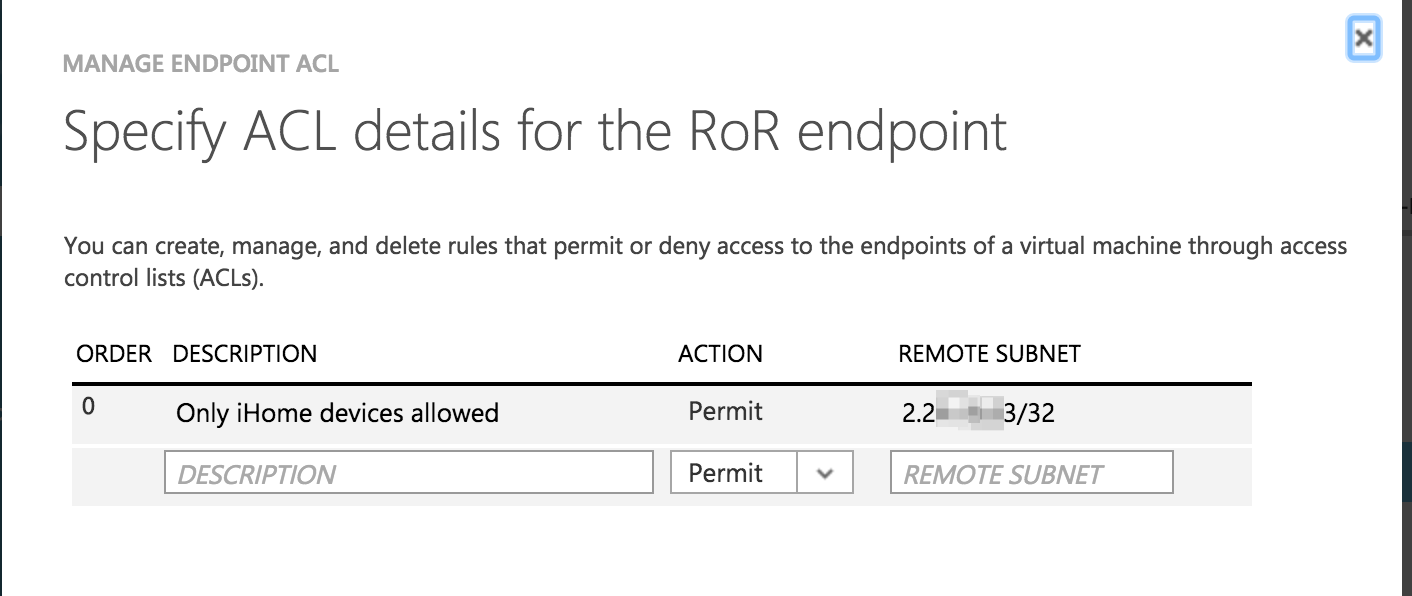
The disadvantage with the ACL rule approach is, my router's public IP may change if restarted.
Also, note the "/32" in the remote subnet; it is a hack (if you like) to comply with CIDR format if using a single IP address.
Analytics!
It's finally time to do some interesting analytics!
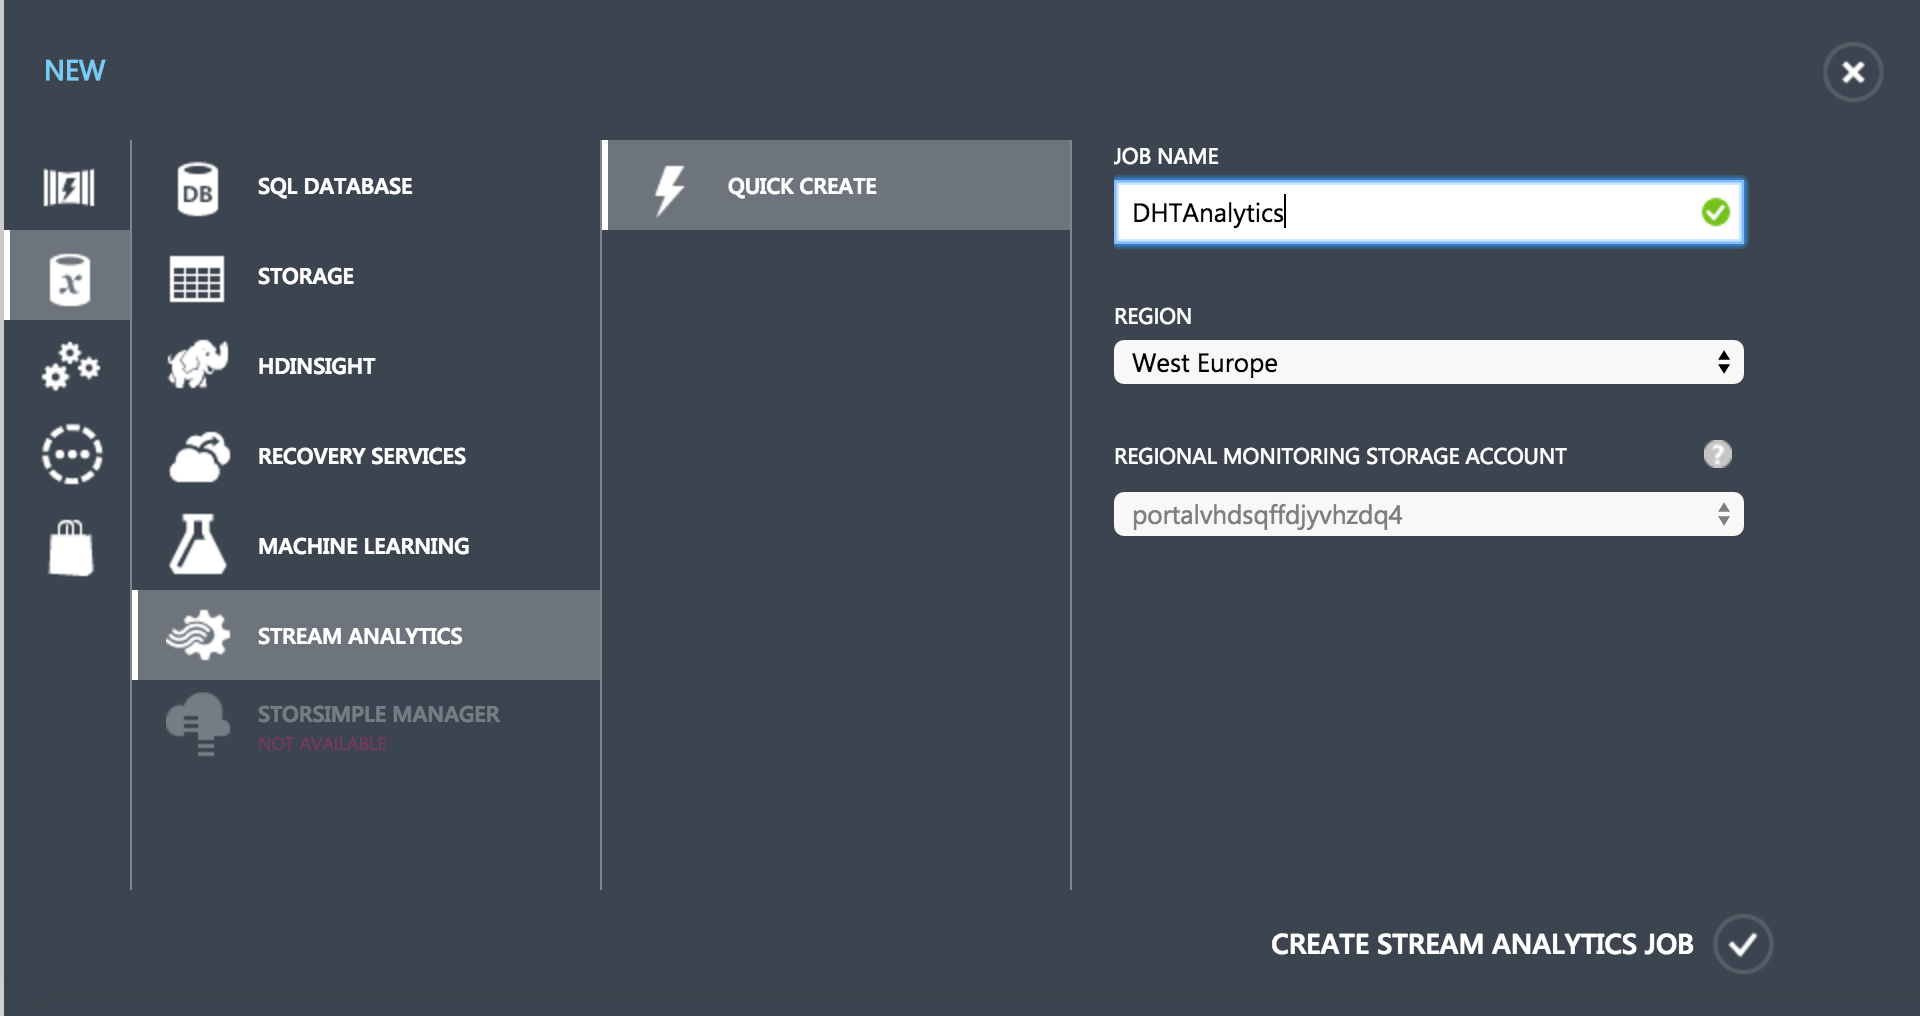
To do this, we'd need to create a second stream analytics job called DHTAnalytics with two outputs - first out goes to SQL database and the second goes to PowerBI.
DHTAnalytics job:
Once created, add an Input by navigating to Input -> Add Input -> Data Stream -> Event Hub; use DHTStreamAnalytics as the alias. 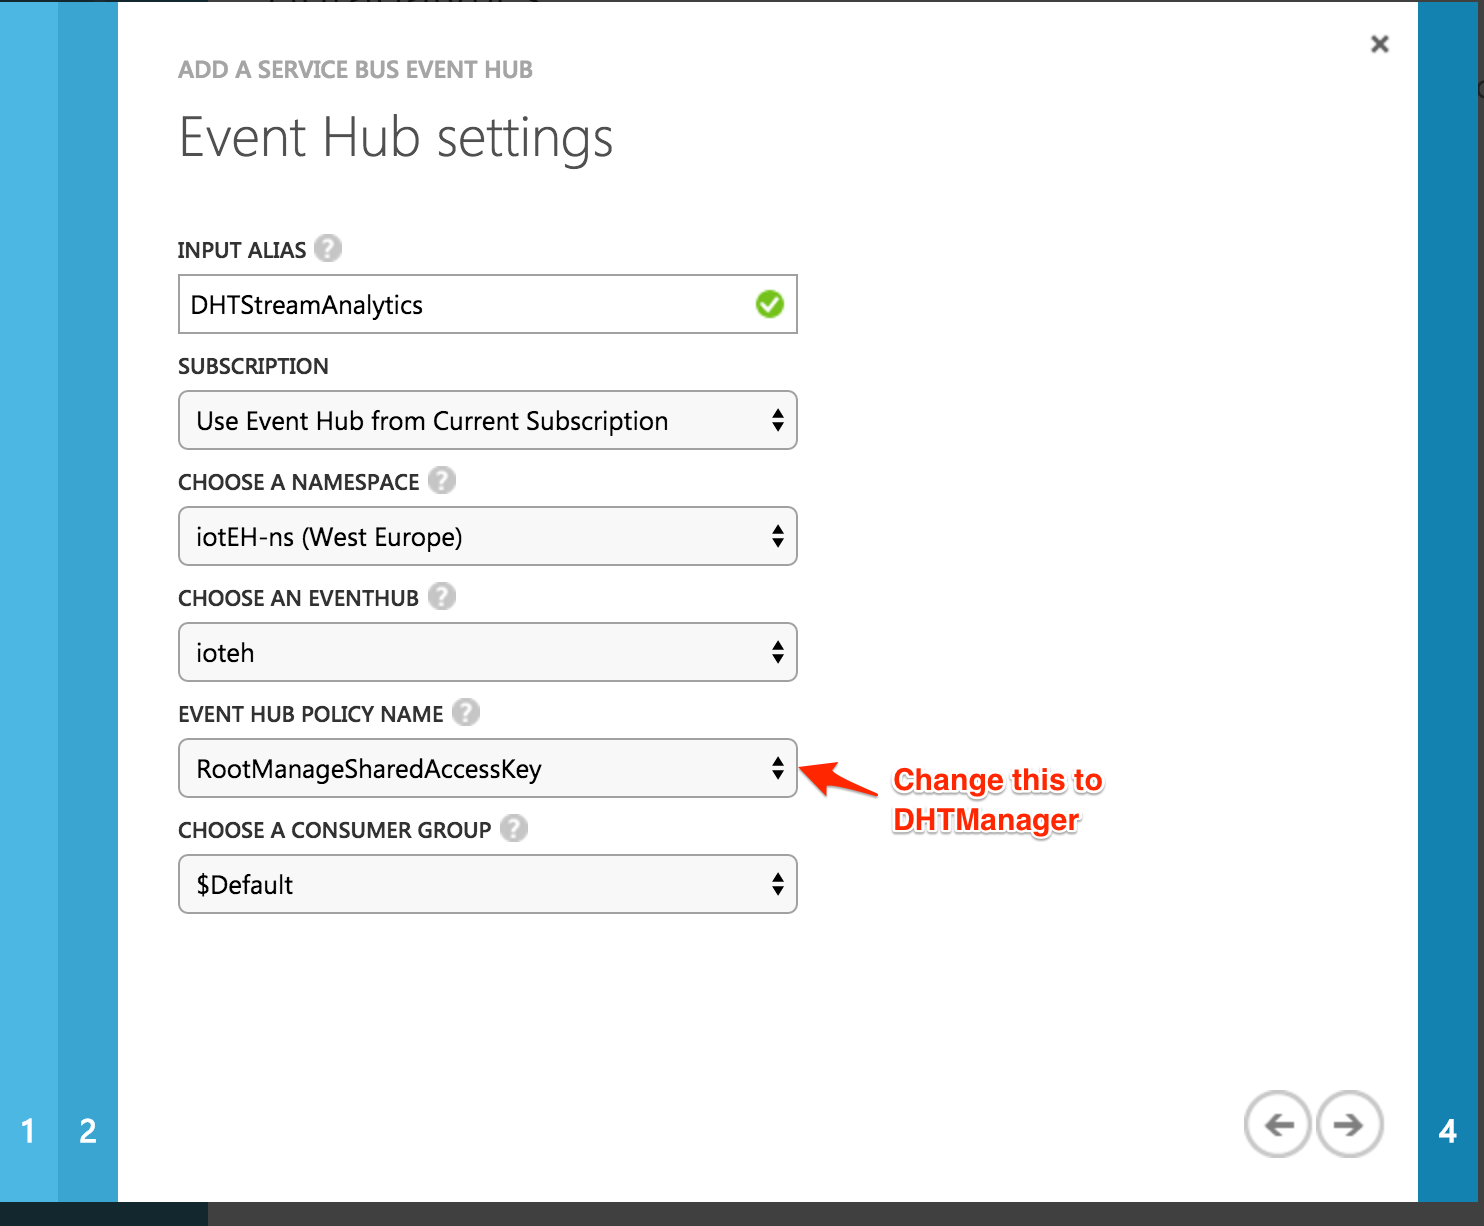
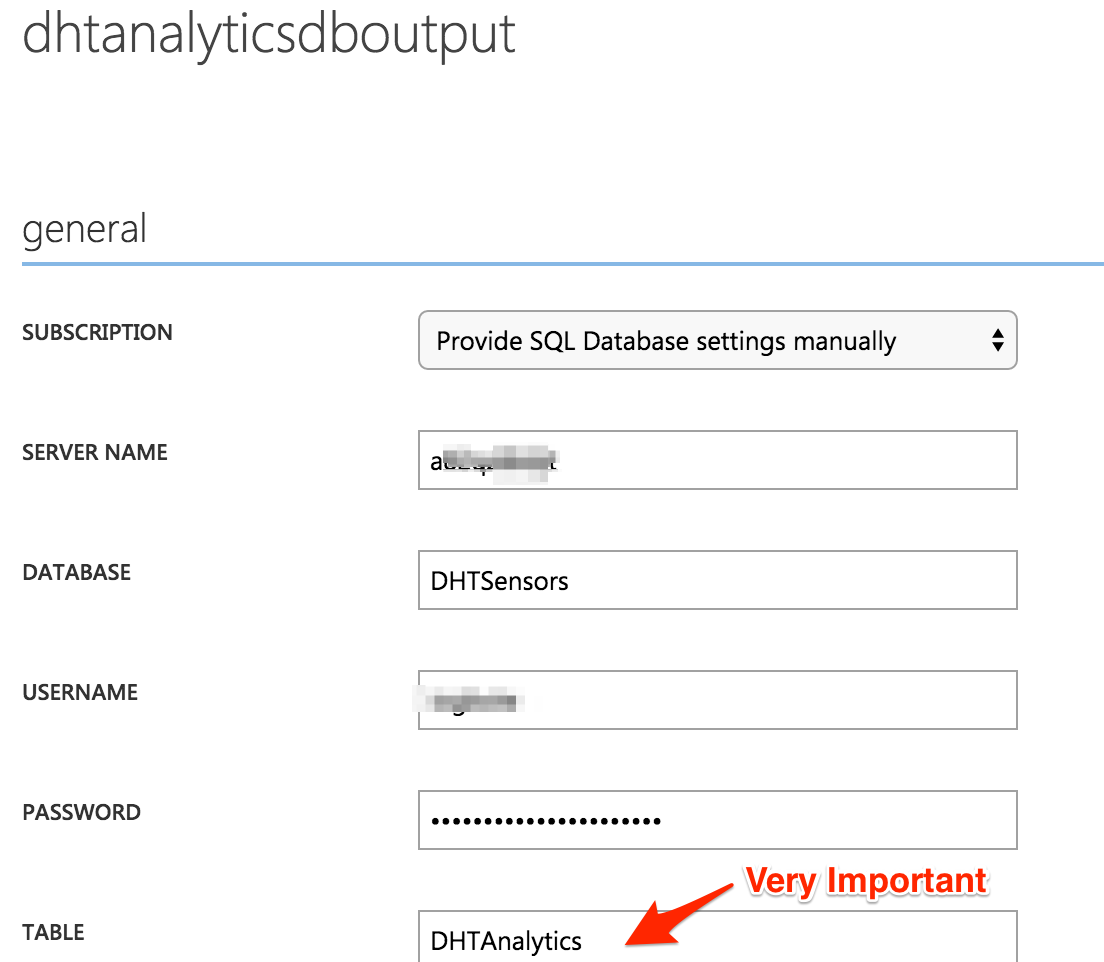
Next, add an SQL Database OUTPUT; use DHTAnalyticsDBOutput as the alias and DHTAnalytics as the table name.
Next,create a Power BI Output; Add Output -> Select Power BI. Once authenticated, use DhtPowerBIOutput as the alias and whatever you like for the dataset name and table name:
In all, your setup should look like: 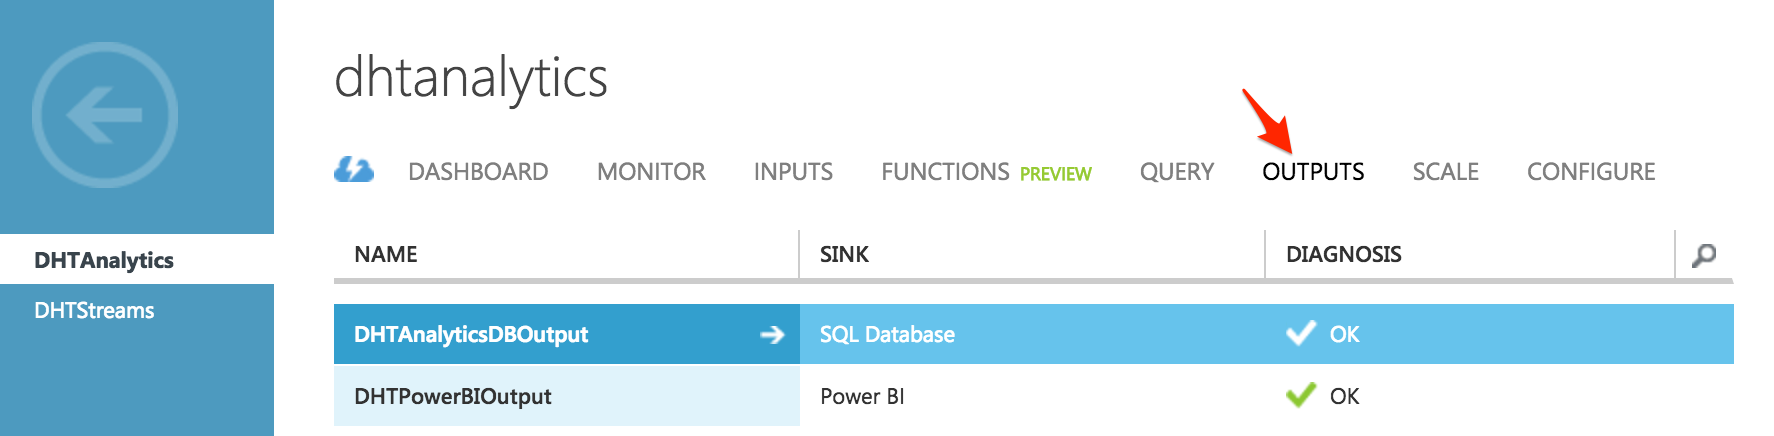
Finally, copy/paste this query into the QUERY text area.
 SELECT
    DateAdd(second,-15,System.TimeStamp) as startTime,
    system.TimeStamp as endTime,
    chipid,
    Avg(heat_index) as avgHeatIndex,
    Avg(temperature) as avgTemperature,
    Avg(humidity) as avgHumidity,
    Count(*) as totalCount
 INTO dhtanalyticsdboutput
FROM DHTStreamAnalytics
GROUP BY TumblingWindow(hour, 1), chipid

SELECT
    DateAdd(second,-15,System.TimeStamp) as startTime,
    system.TimeStamp as endTime,
    chipid,
    Avg(heat_index) as avgHeatIndex,
    Avg(temperature) as avgTemperature,
    Avg(humidity) as avgHumidity,
    Count(*) as totalCount
INTO dhtpowerbioutput
FROM DHTStreamAnalytics
GROUP BY TumblingWindow(hour, 1), chipid
Note that the INTO clause is used to direct output to the DB and PowerBI outputs respectively. Directing outputs with a query is basically what you'd need to do if you have multiple outputs for one stream analytics job. Admittedly, it took me a while to figure that out.
Also, note that I am using a Tumbling Window of 1 hour, so I'd expect IoT to send ≈6 readings in a window.
Start the Job!
The Result
Connect Arduino VIN pin to a 5.5v power supply and watch your hard work pay off!
PowerBI Output
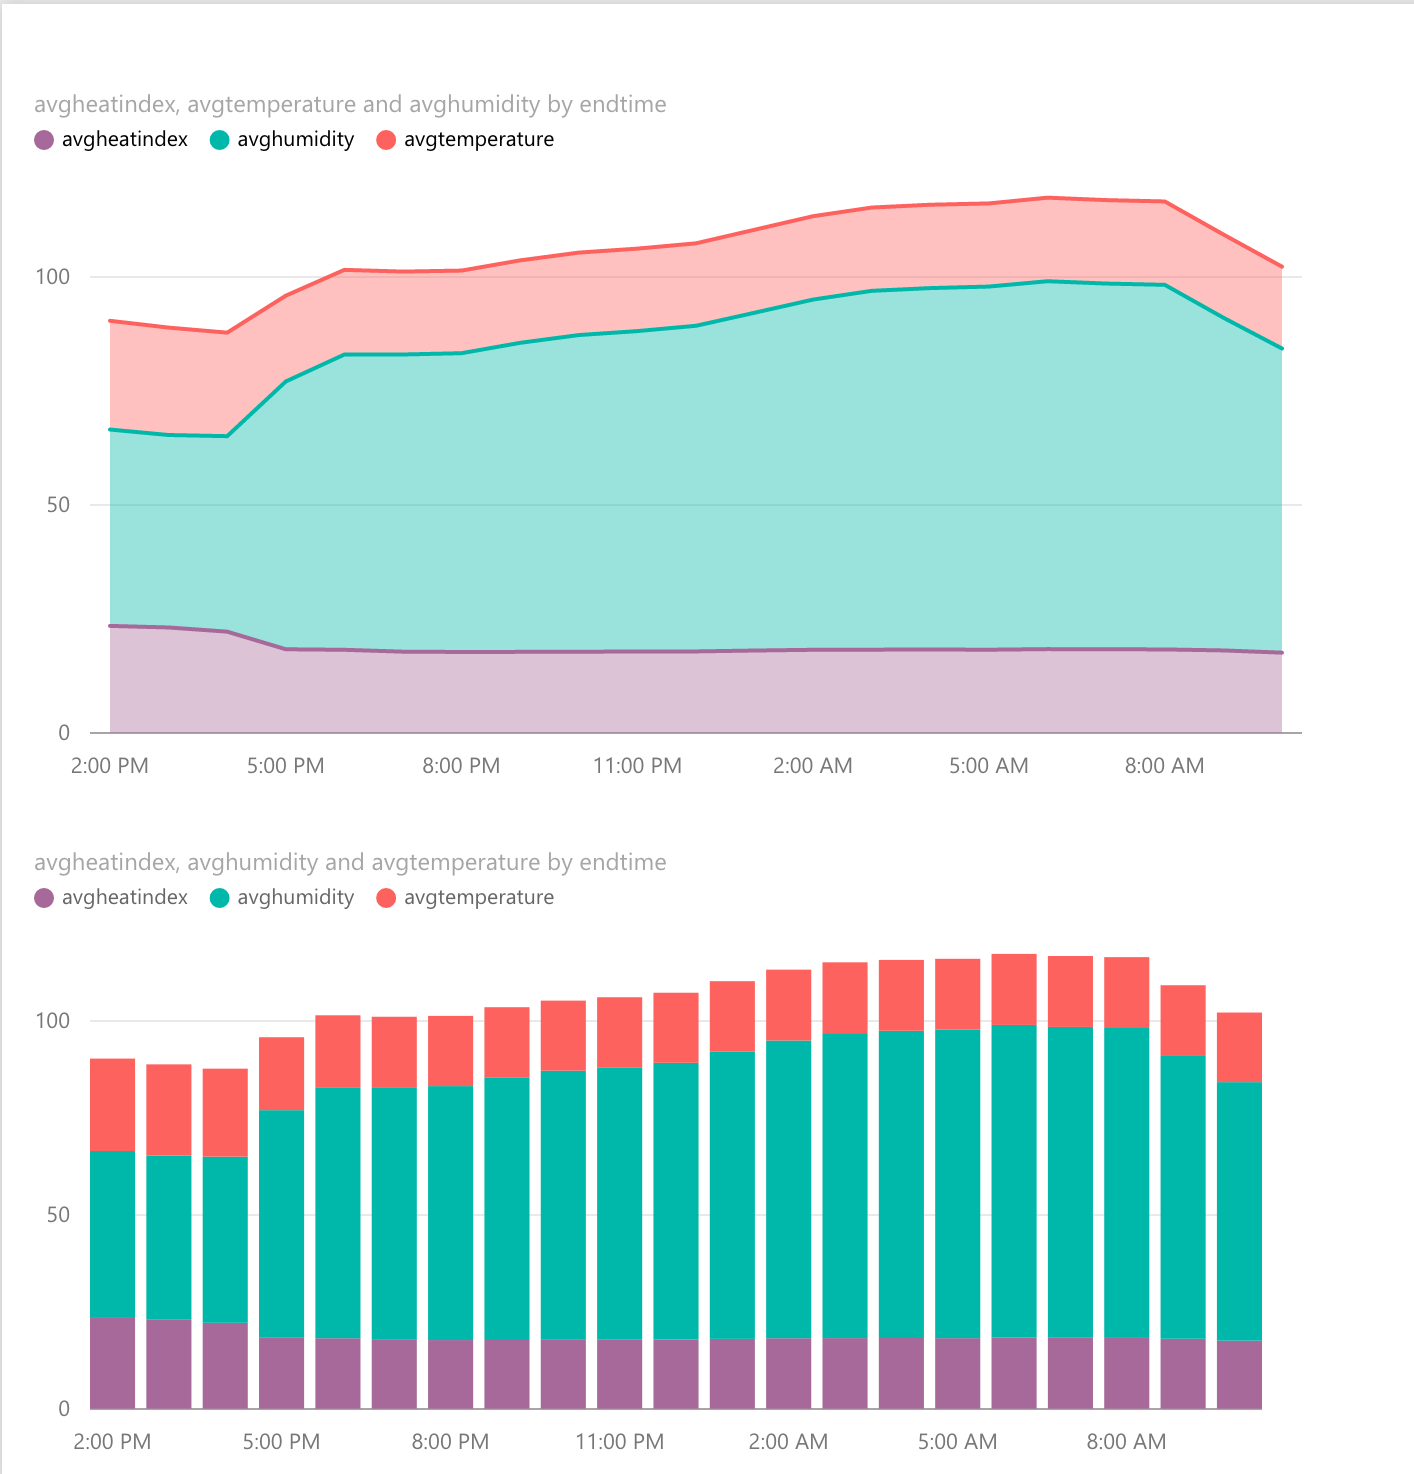
and 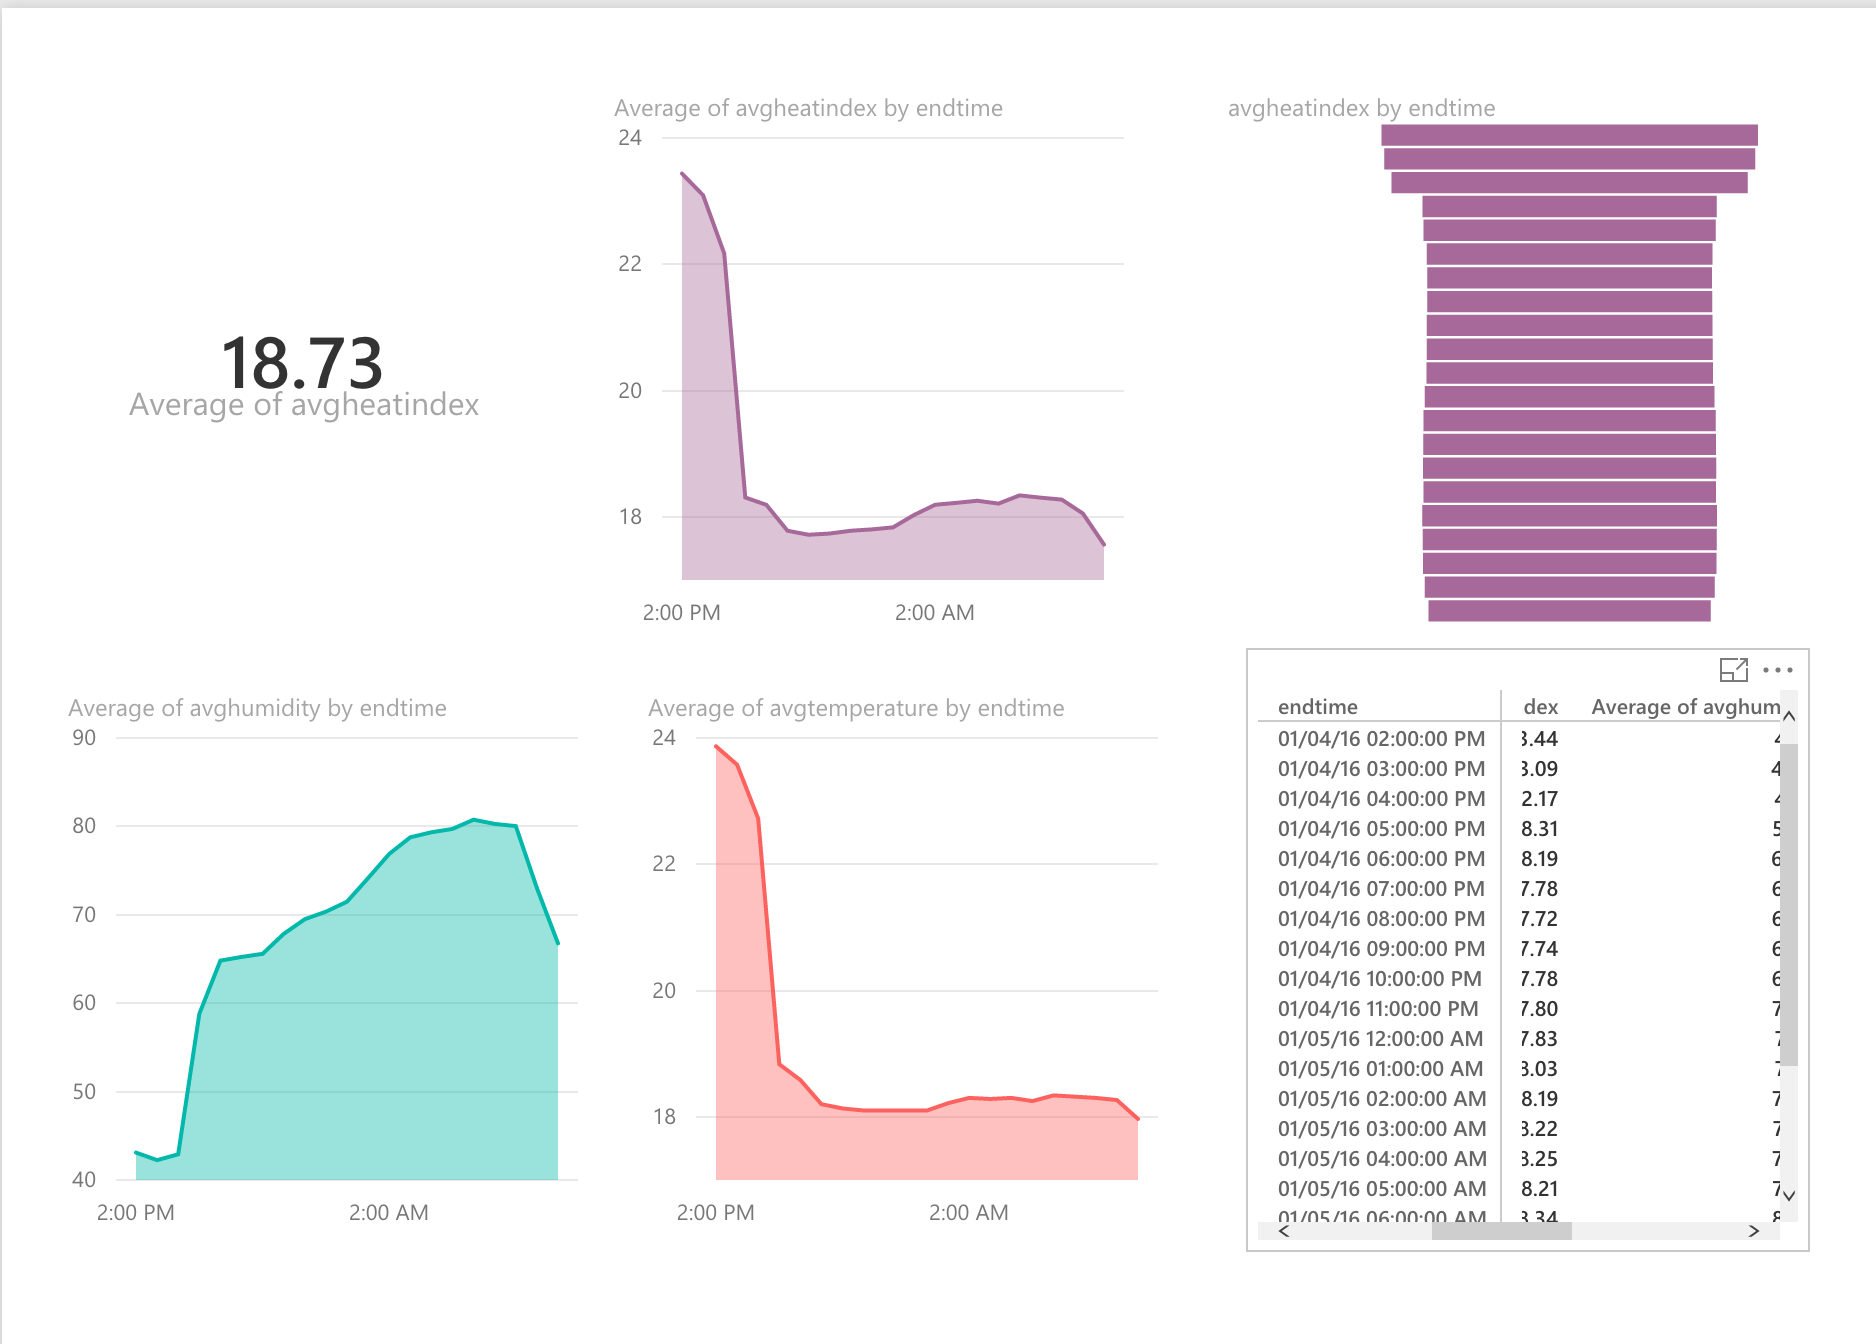
Clearly, I have high humidity problem.
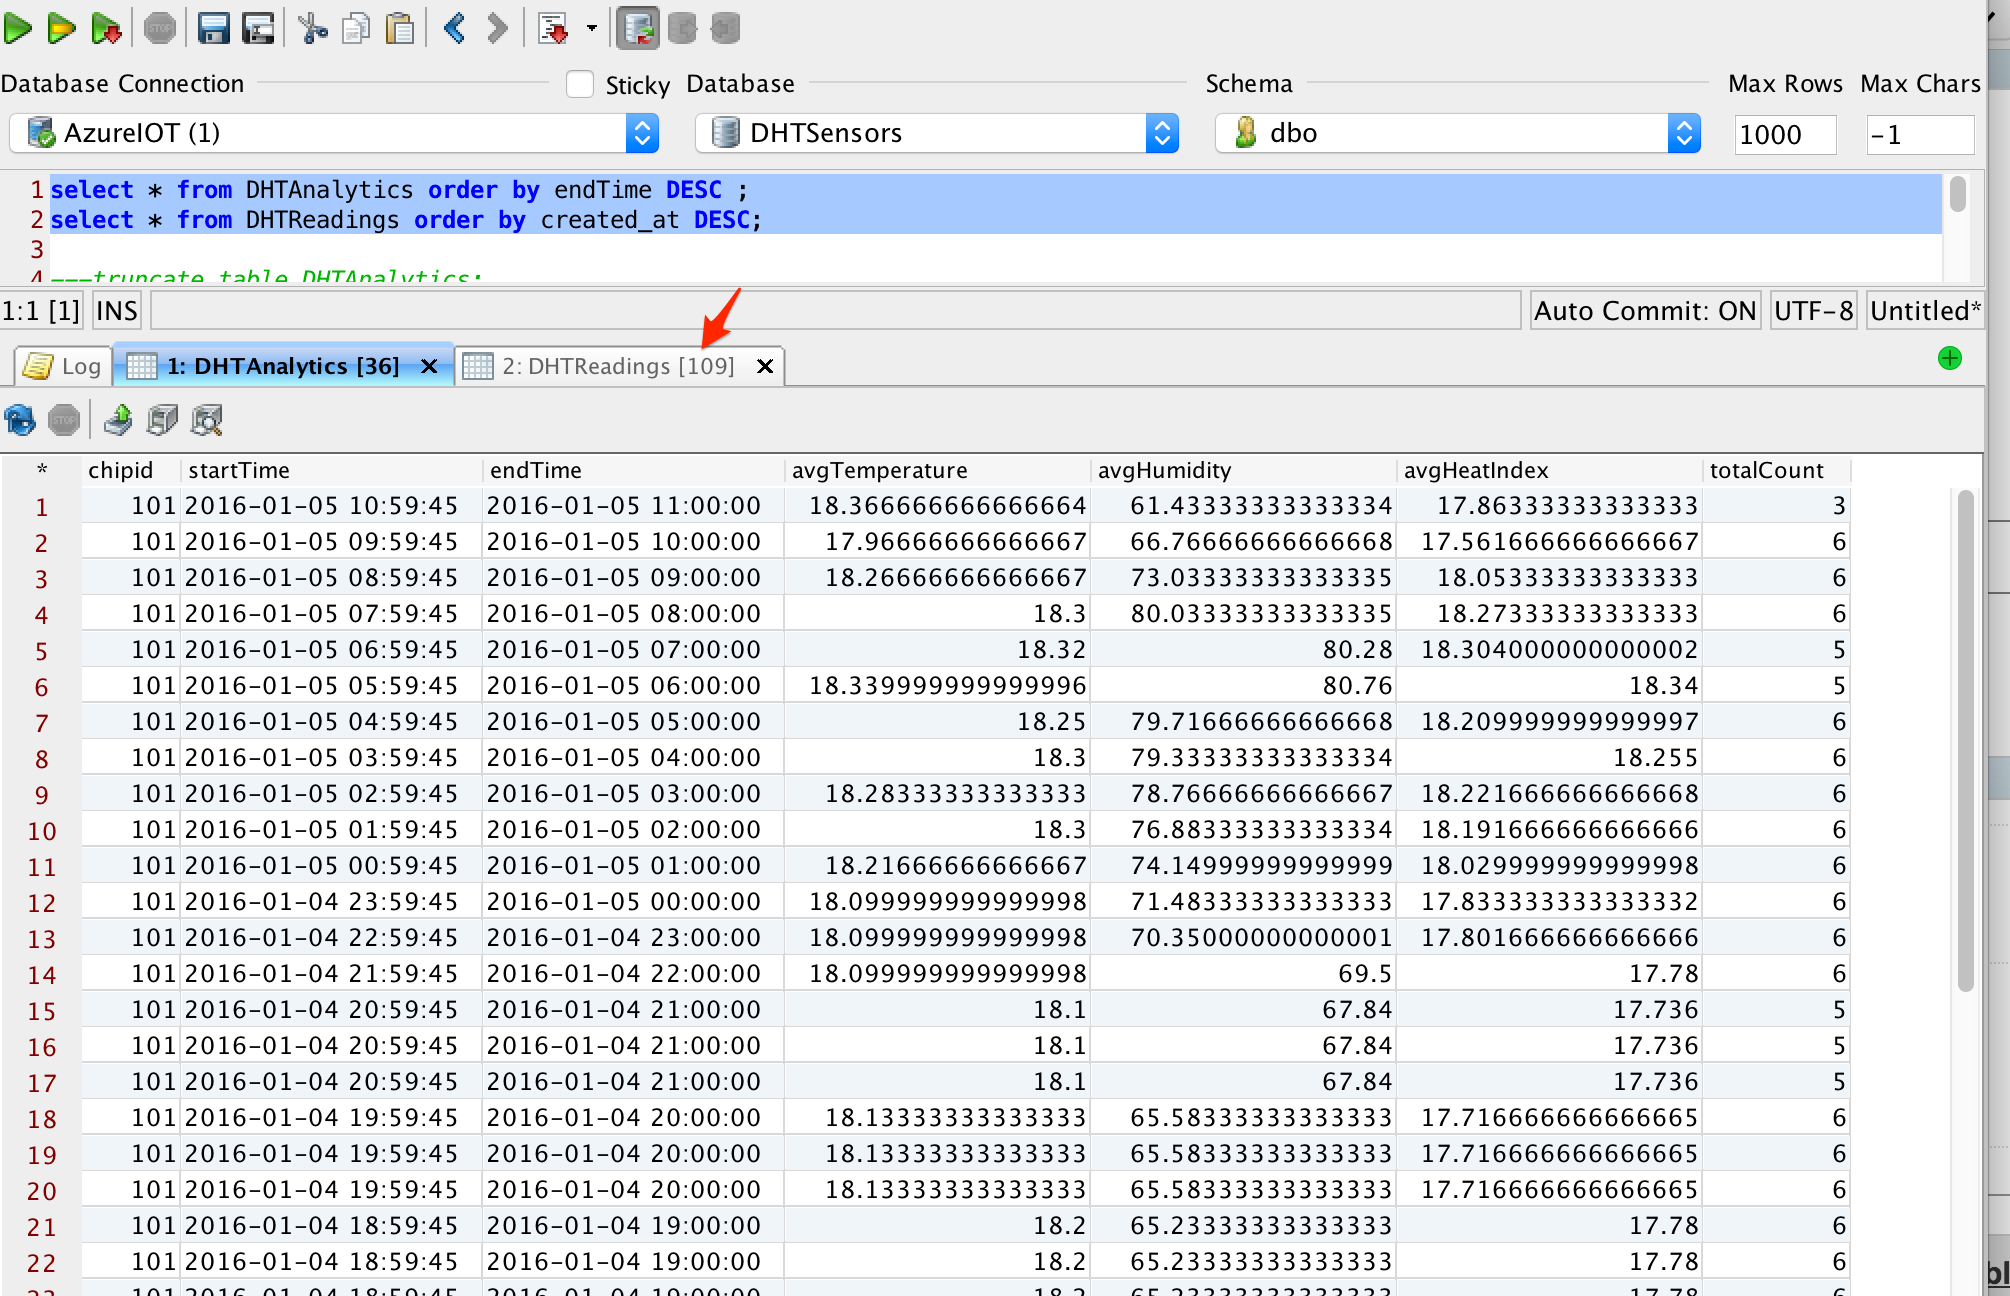
SQL Output
 select * from DHTAnalytics order by endTime DESC ;
select * from DHTReadings order by created_at DESC;
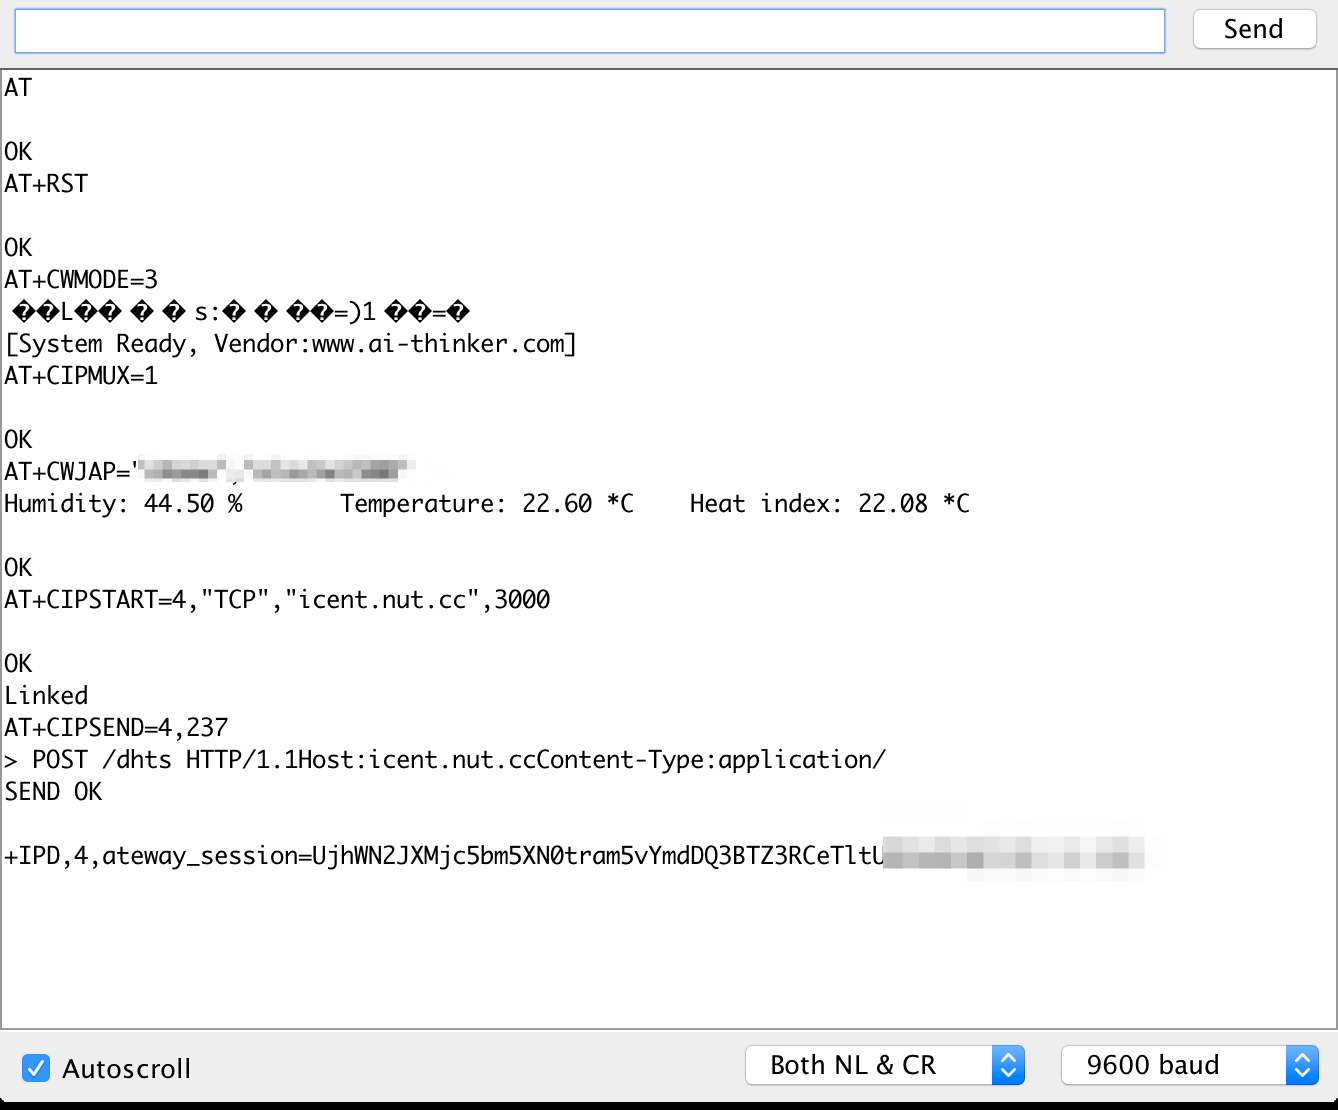
Arduino Output (before unplugging it from USB):
The end :)
What's next?
I ordered 2 of this Relay Module. Once they arrive I will hook it up to an extension box so I can control our De/Humidifier depending on the sensor readings. That is, if average humidity readings over X period of time is greater than %Y or lower than %Z turn it ON. Another idea is to be able to turn our heater ON/OFF from my mobile using one of those relay modules.
References :
- https://msdn.microsoft.com/en-us/library/azure/dn790664.aspx
- https://azure.microsoft.com/en-gb/documentation/articles/virtual-machines-set-up-endpoints/
- https://azure.microsoft.com/en-us/documentation/articles/stream-analytics-define-outputs/
- https://msdn.microsoft.com/en-us/library/azure/dn949330.aspx
[bing_translator]