Streaming IoT Telemetry to Azure Event Hub:Part 2
This blog post is a continuation of Streaming IoT Telemetry to Azure Event Hub : Part 1.
Event Hubs and Stream Analytics
Please refer to these tutorials if you're completely new to Event Hubs. In a nutshell, Event Hub (EH) is a Microsoft Azure service that can accept millions of telemetry data from multiple devices per second. Once the data is in the hub, you can then store it and/or transubstantiate it using any real time analytics service, such as Azure Stream Analytics.
Referring to the problem statement in part 1 of this blog series, I explained why we'd need an IoT Gateway to mediate between the IoT component (or event generators if you like) and Event Hub.
This post focuses on how to set up Event Hub and how to use Stream Analytics to analyse the data in the hub at real time. The next blog demonstrates how you can send events from any application to Event Hubs using its APIs. Please take screenshots whilst you are creating the EH service because you're going to need the names of your services for the programming bit in the next blog.
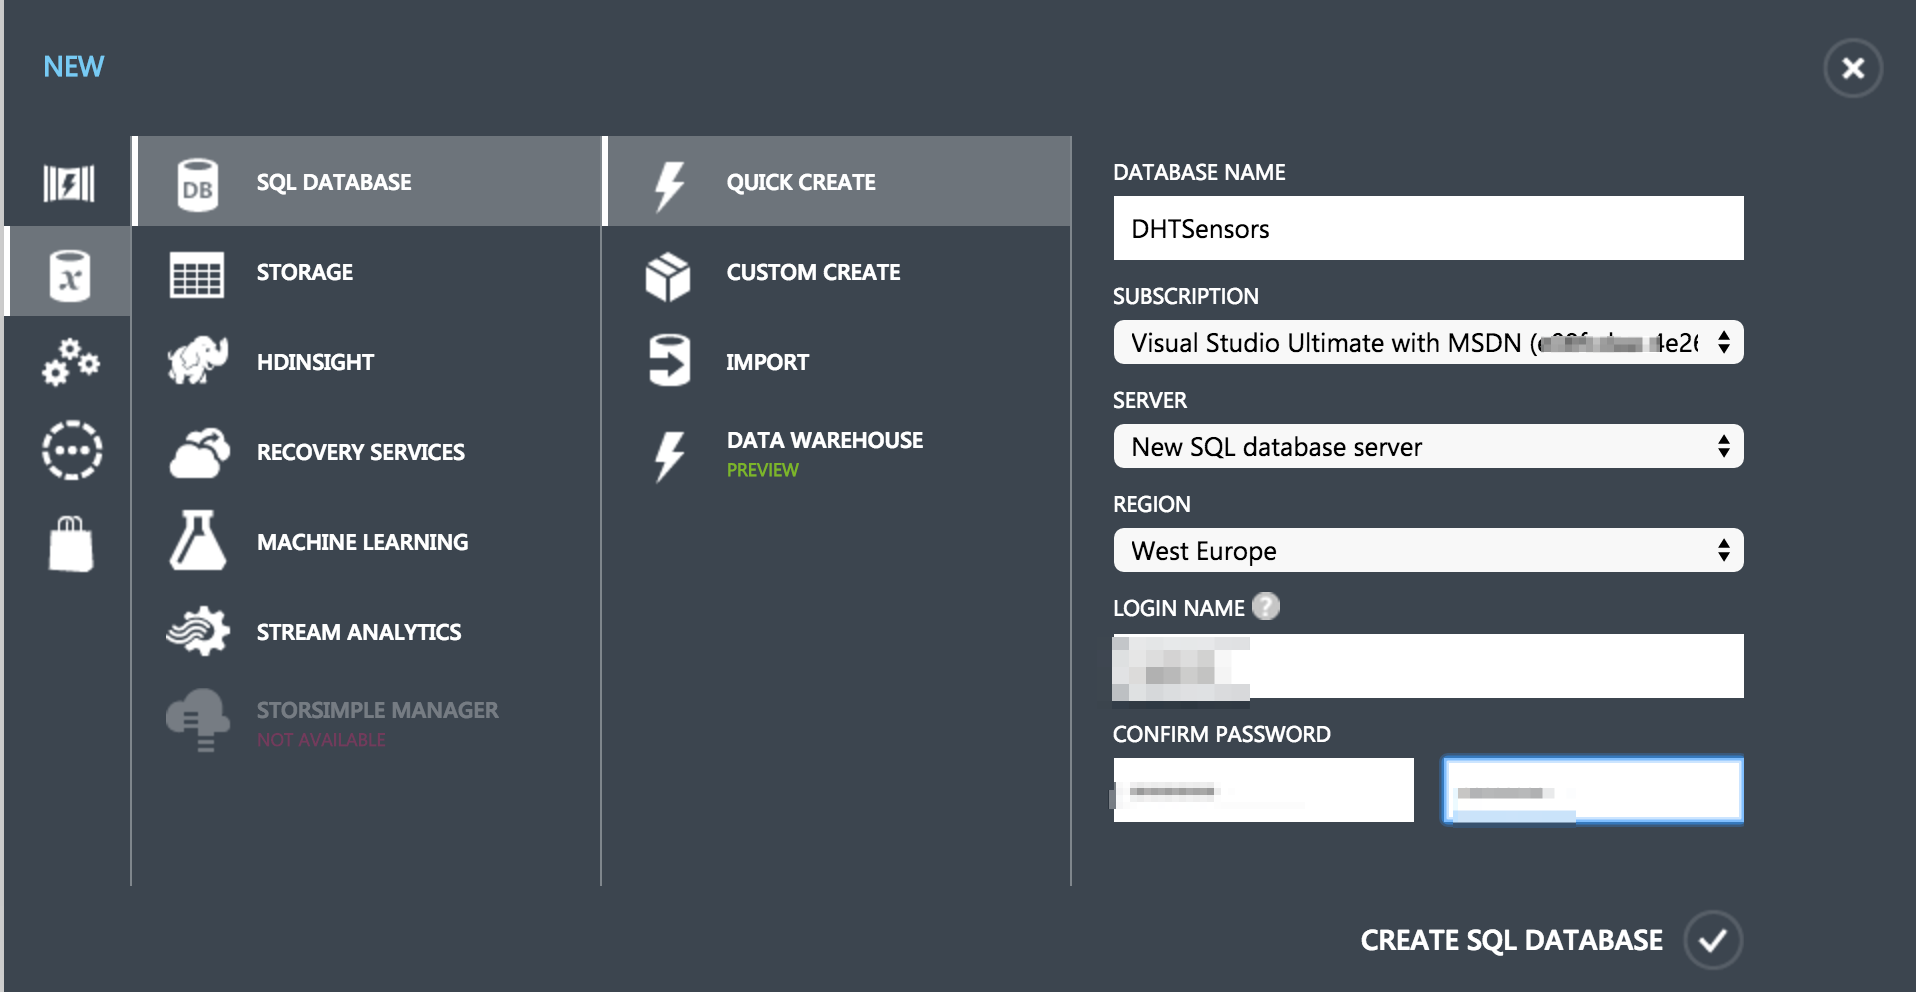
Create an Azure Database
First, you'd need to create a Database from Azure Management portal
Once the database has been created, you can either use the Visual Studio integration or any other DB management application. I am using DbVisualizer. I found that the integrated "Manage" feature doesn't always work well. To use DbVisualizer, you'd need to add your machine's IP address to DB's firewall rule; Dashboard -> Manage Allowed IP addresses -> 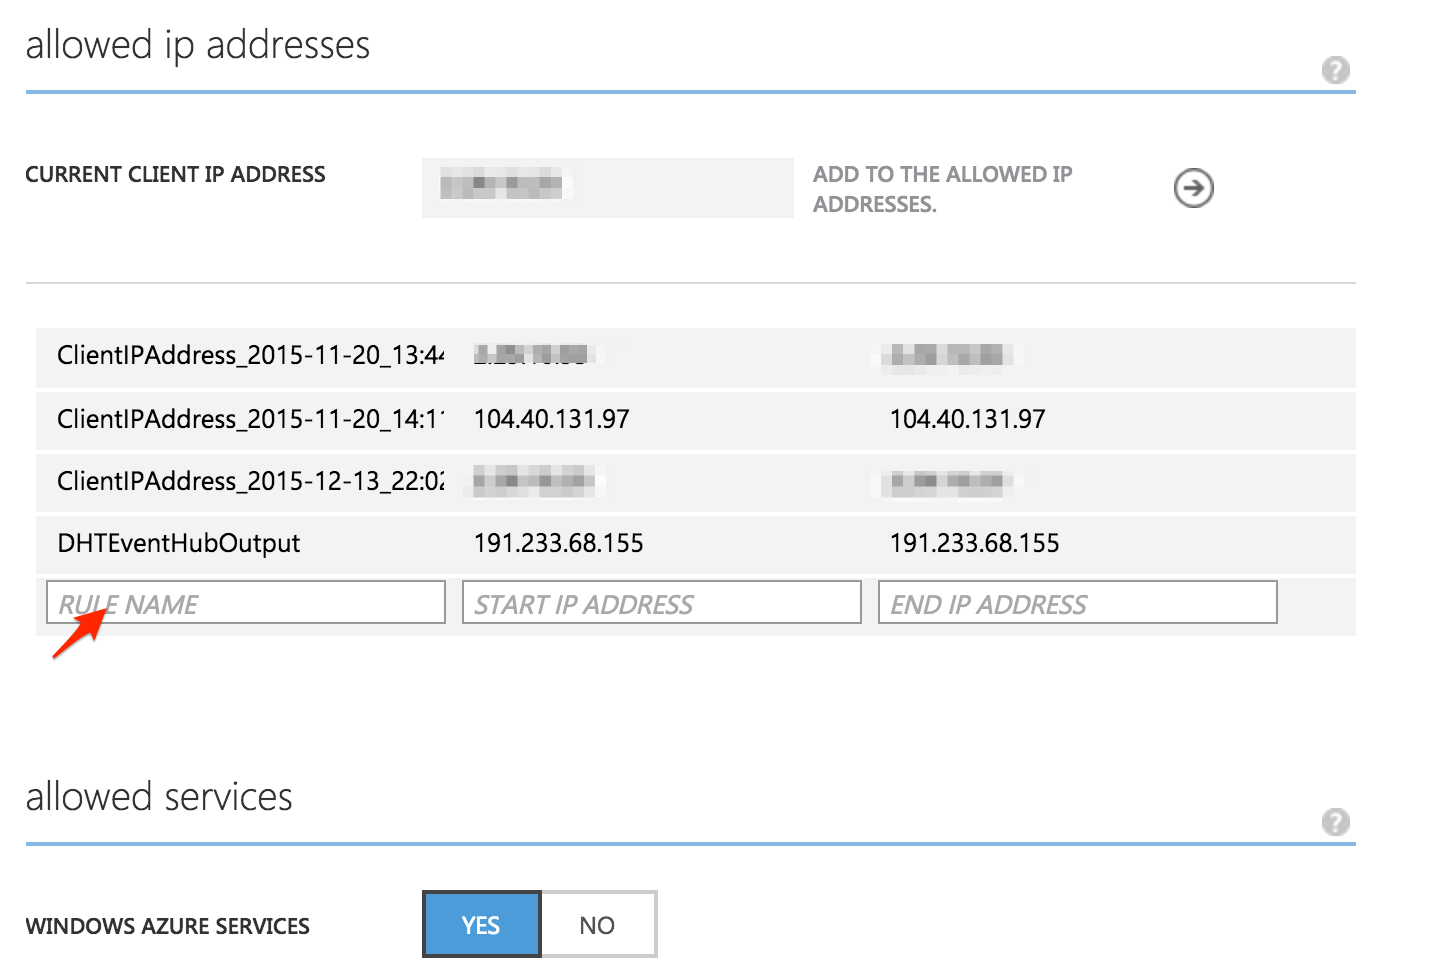
Also, you'd need to download the SQL server JDBC connector and follow the instructions in DbVisualizer to complete the setup.
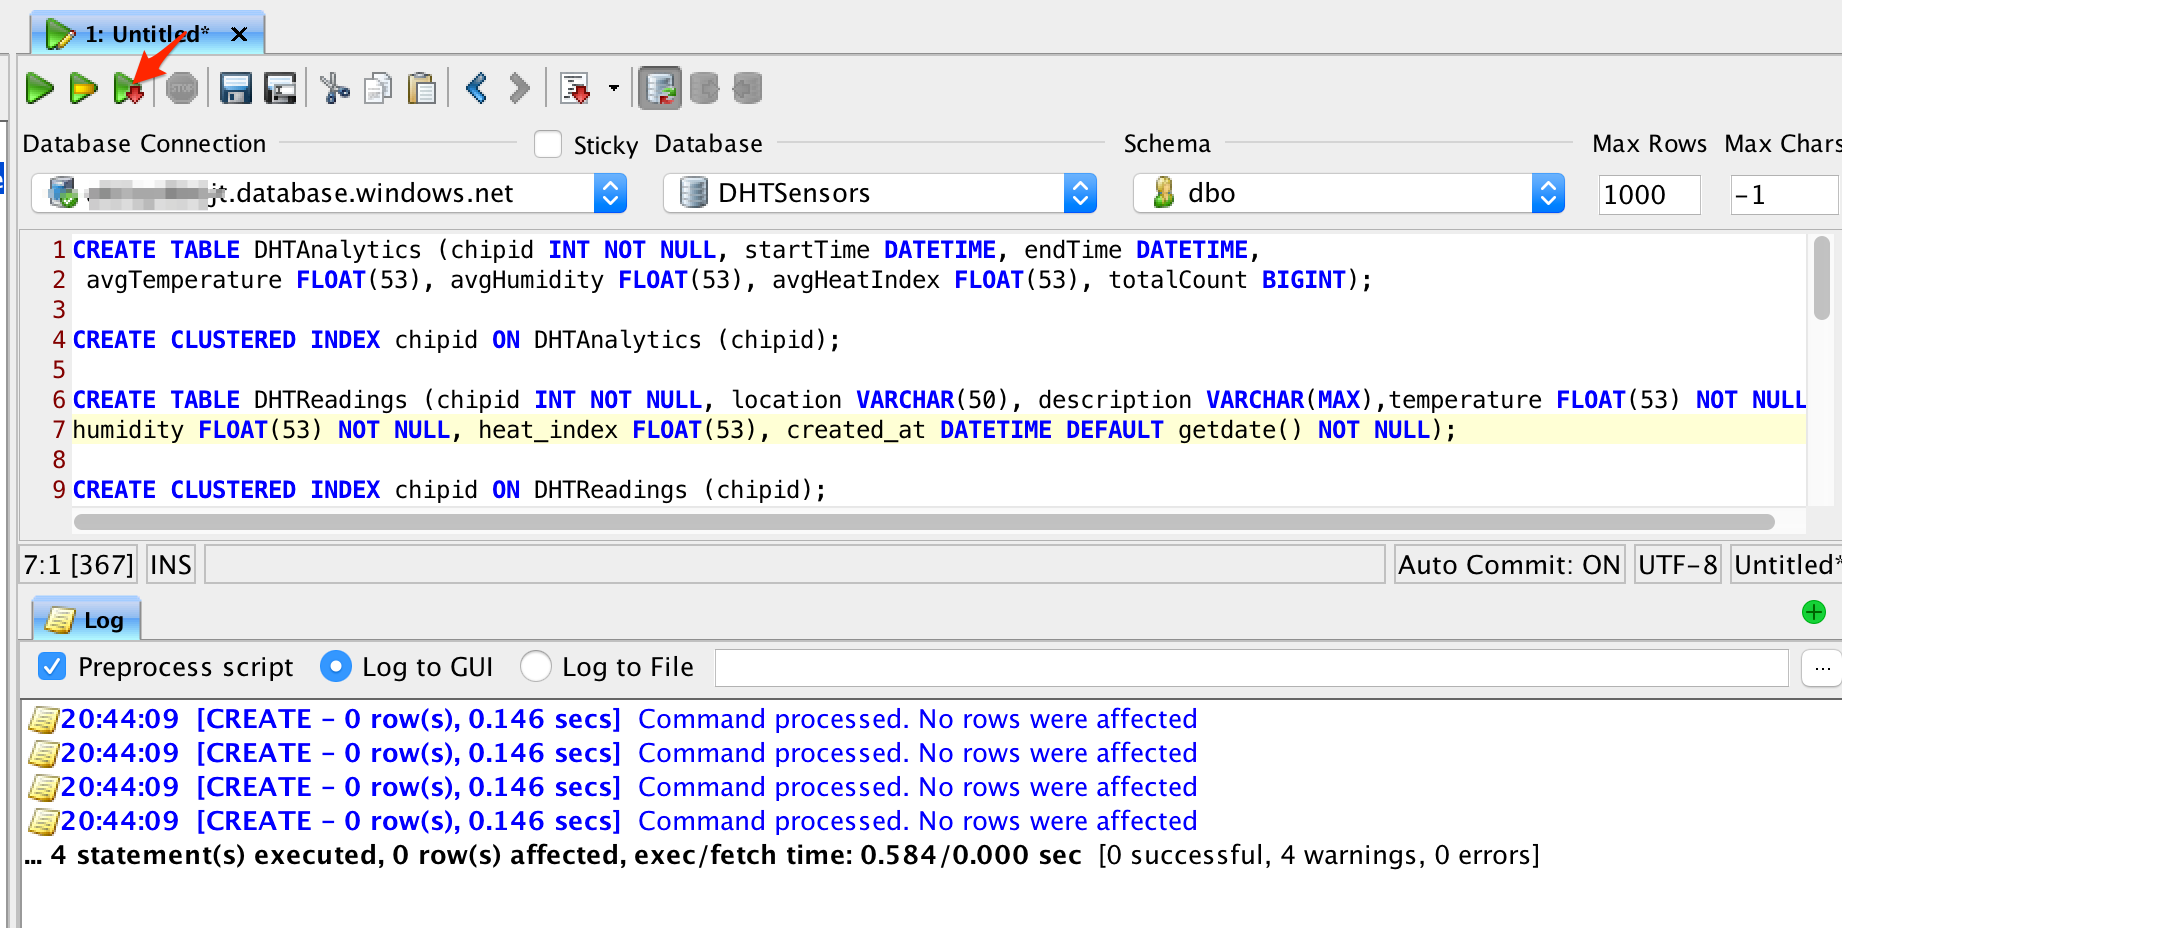
Create the DHTReadings and DHTAnalytics tables with their respective clustered indexes:
 CREATE TABLE DHTAnalytics (chipid INT NOT NULL, startTime DATETIME, endTime DATETIME,
 avgTemperature FLOAT(53), avgHumidity FLOAT(53), avgHeatIndex FLOAT(53), totalCount BIGINT);

CREATE CLUSTERED INDEX chipid ON DHTAnalytics (chipid);

CREATE TABLE DHTReadings (chipid INT NOT NULL, location VARCHAR(50), description VARCHAR(MAX),temperature FLOAT(53) NOT NULL,
humidity FLOAT(53) NOT NULL, heat_index FLOAT(53), created_at DATETIME DEFAULT getdate() NOT NULL);

CREATE CLUSTERED INDEX chipid ON DHTReadings (chipid);
DbVisualizer buffer execution output:
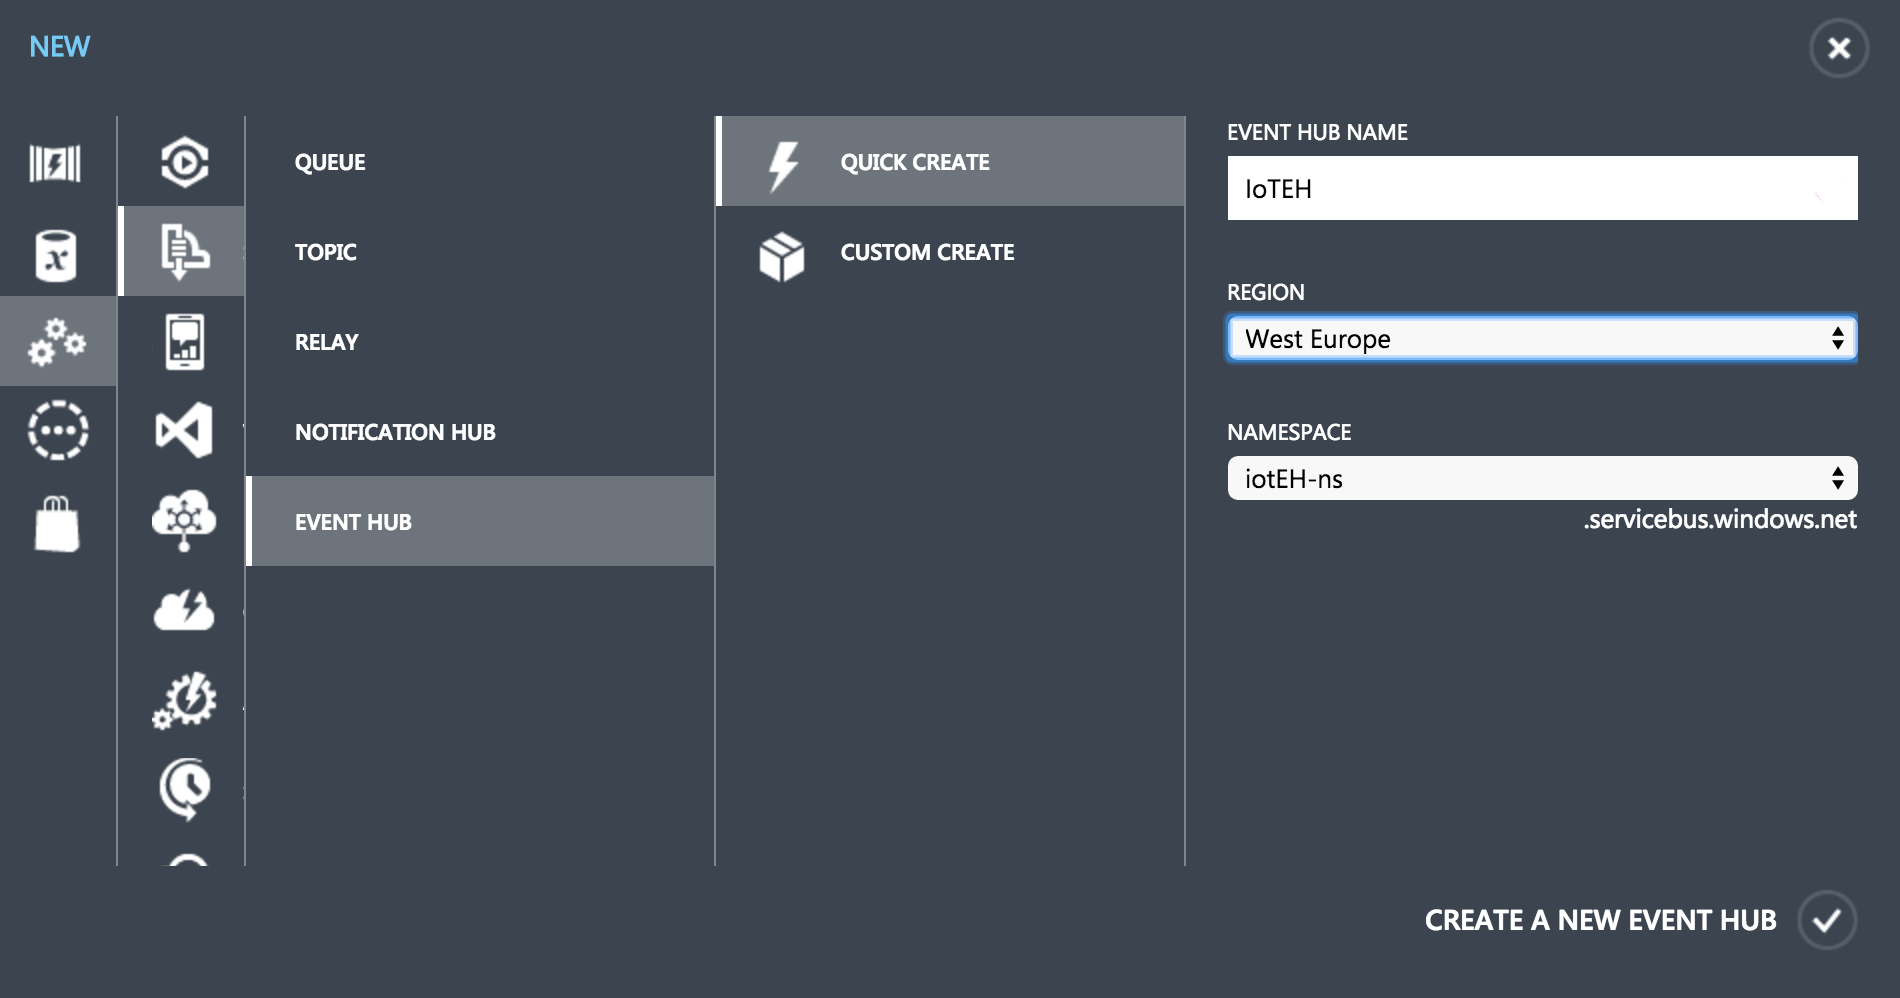
Create and Configure an Event Hub:
Creating an Event Hub from Azure management portal is also pretty straight forward.
Once created, go ahead and click on Configure, then create two policies with send and full permissions as shown below: 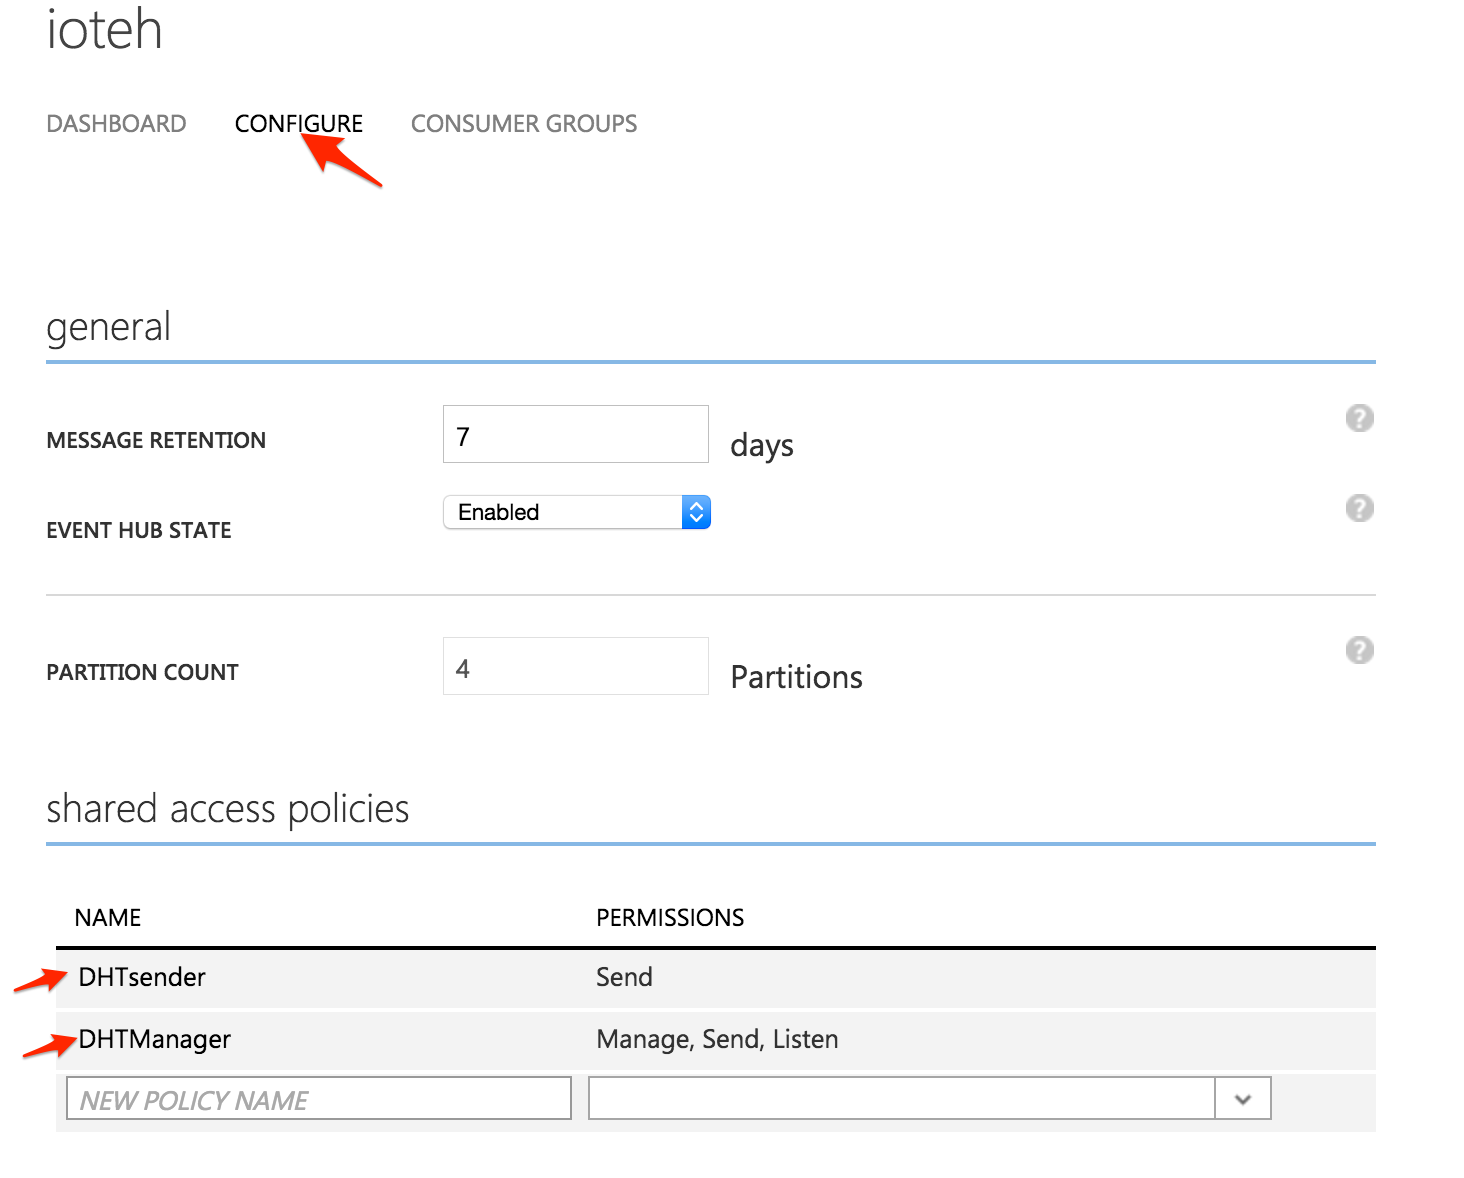
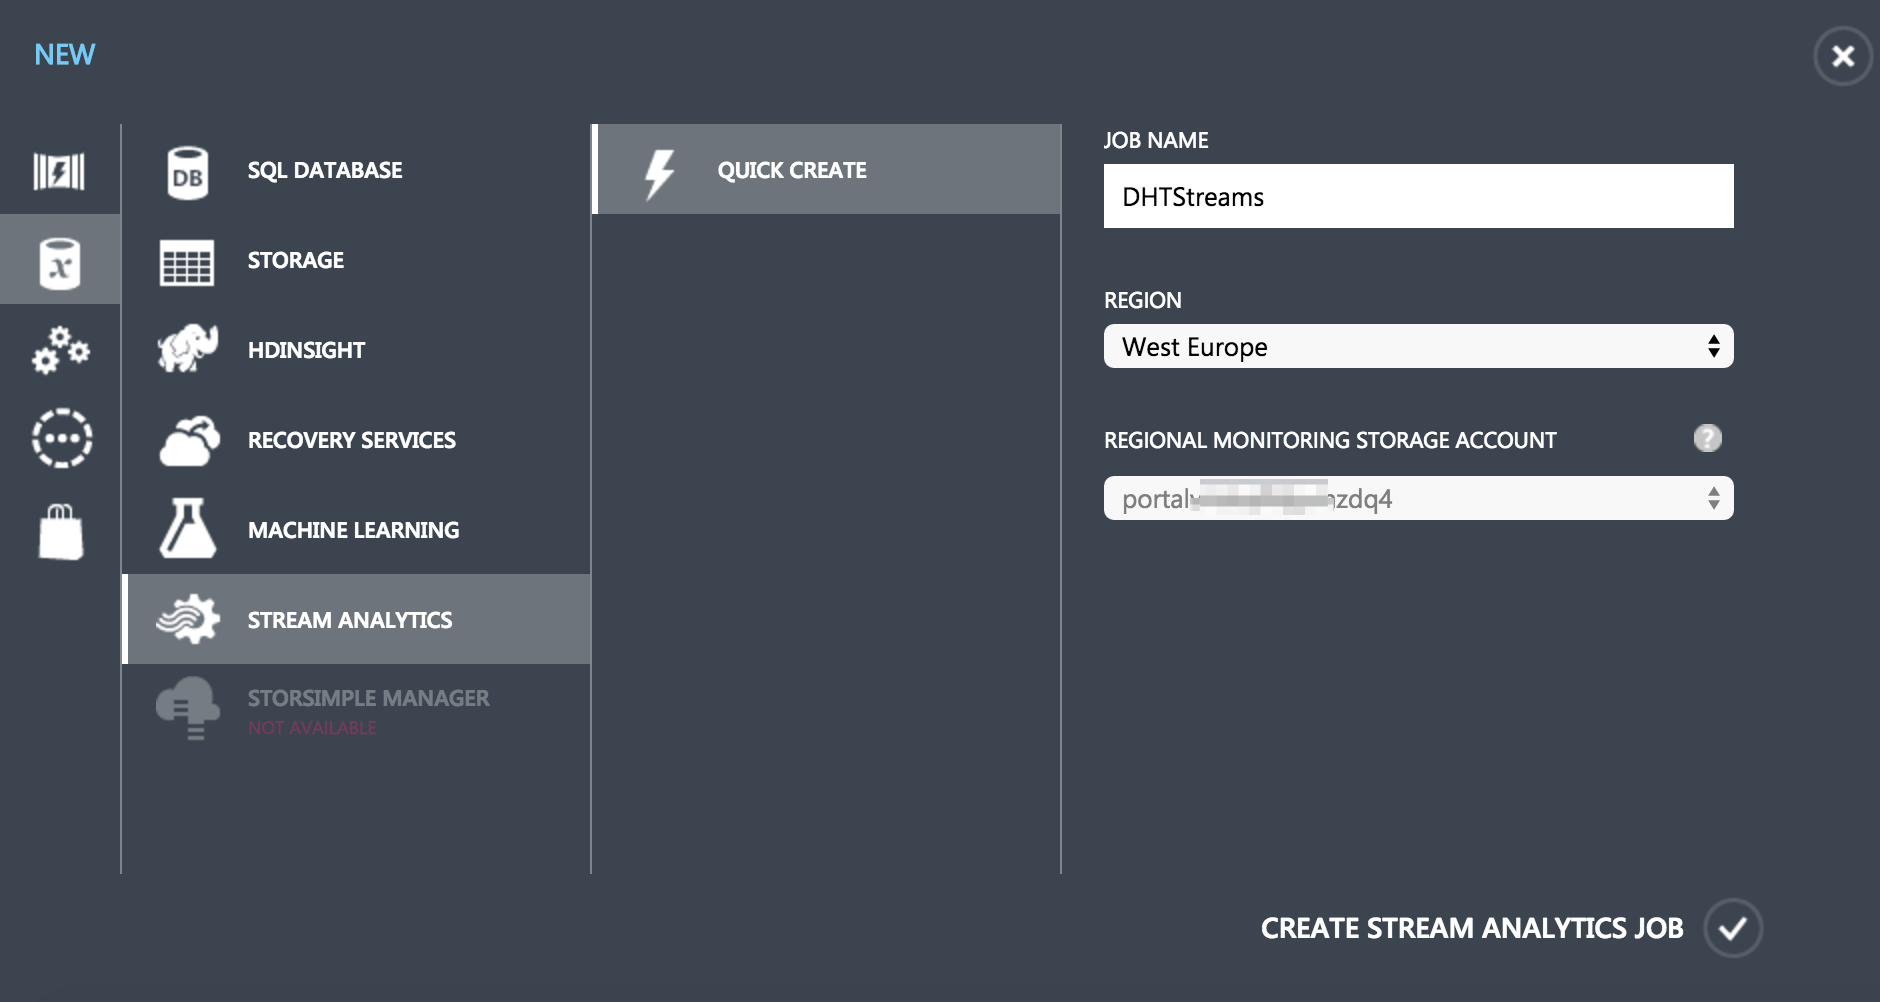
Create a Stream Analytics Job
From Azure management portal:
Once it's been created, add an input to your job by clicking on Add Input -> Data Stream -> Event Hub -> 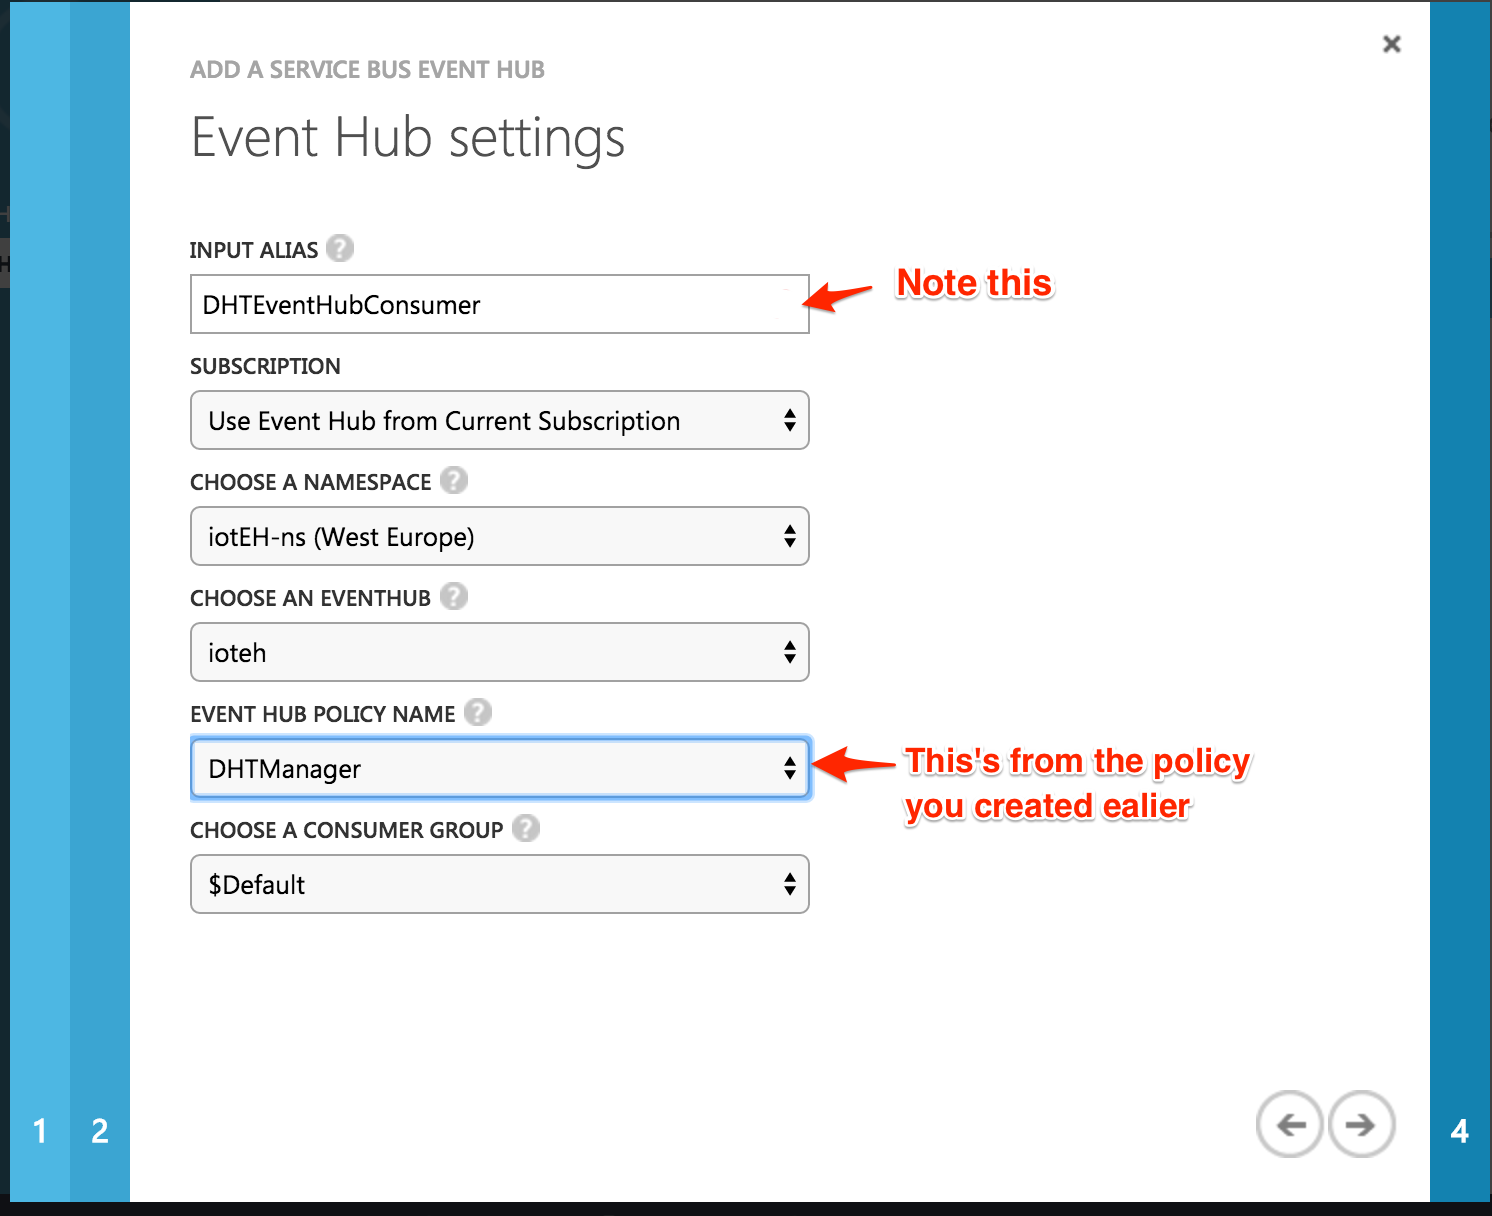
Stream Analytics will now do some self checks to ensure it can connect to your Event Hub. Ensure you get a success before continuing!
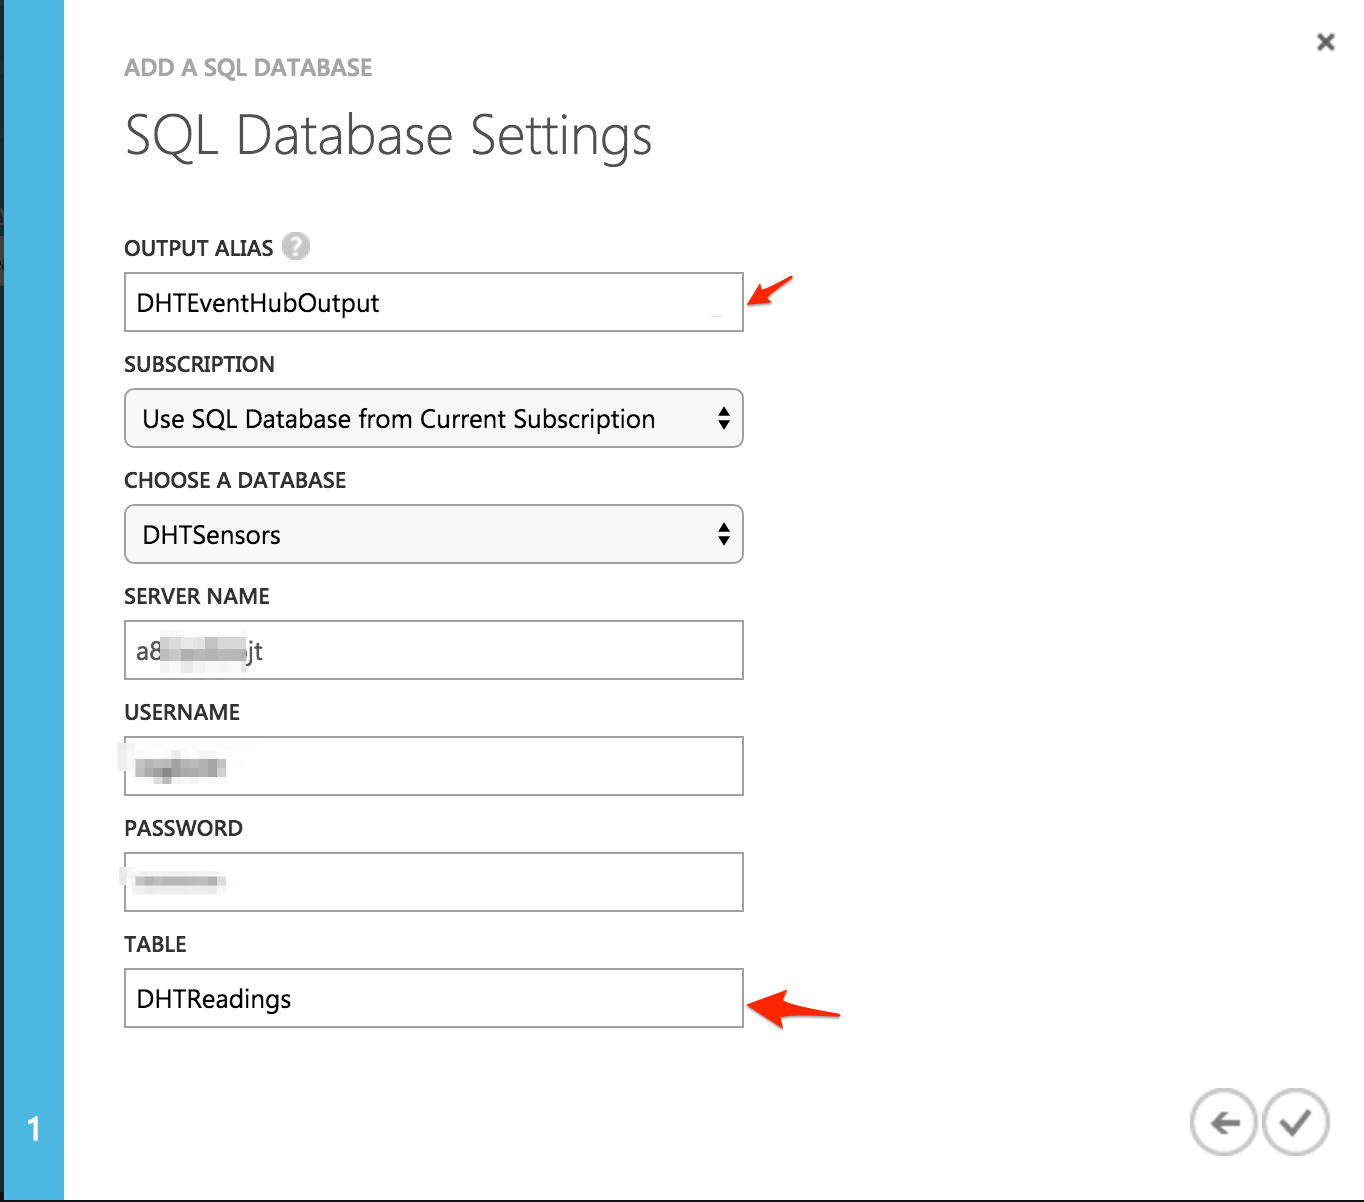
Next, add an output to your job, this is where telemetry data will be stored, the DHTReadings table.
Navigate to OUTPUTS - > Add Output -> SQL Database - >
Finally, create a QUERY to select input fields from Stream Analytics input job, DHTEventHubConsumer; these are the fields in the DHTReadings table. 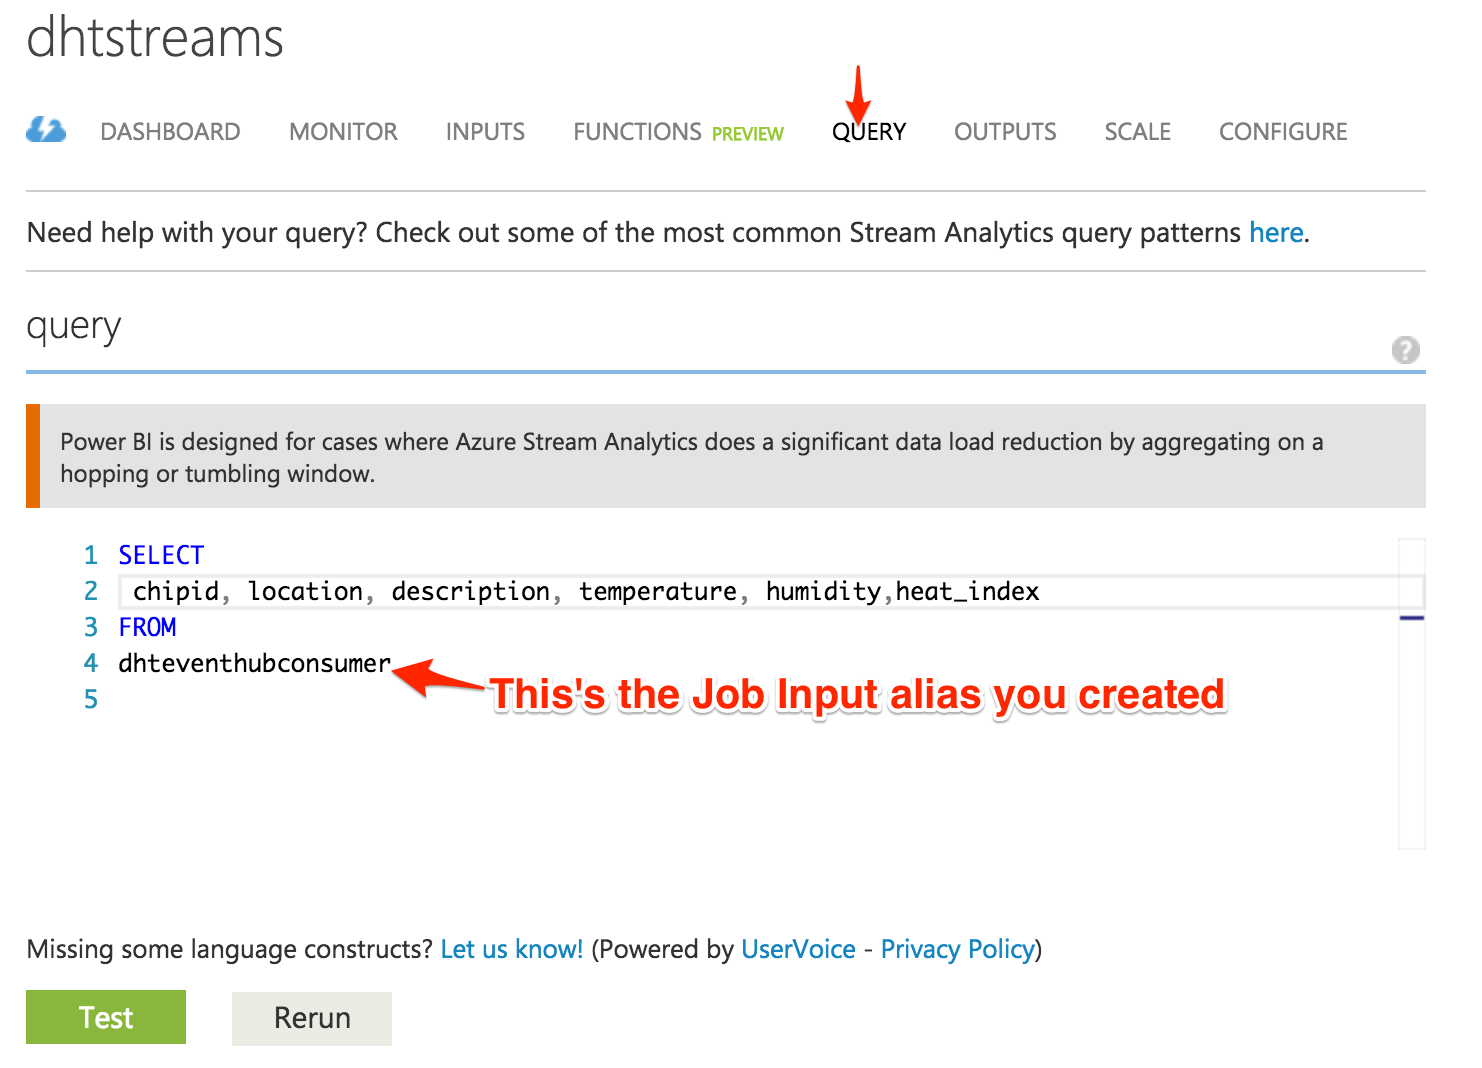
You may now go ahead and test what you've done so far with this test Data - DHTReadings.json
Click Test, upload the json file and it should display a nice output like this if your setup is correct:
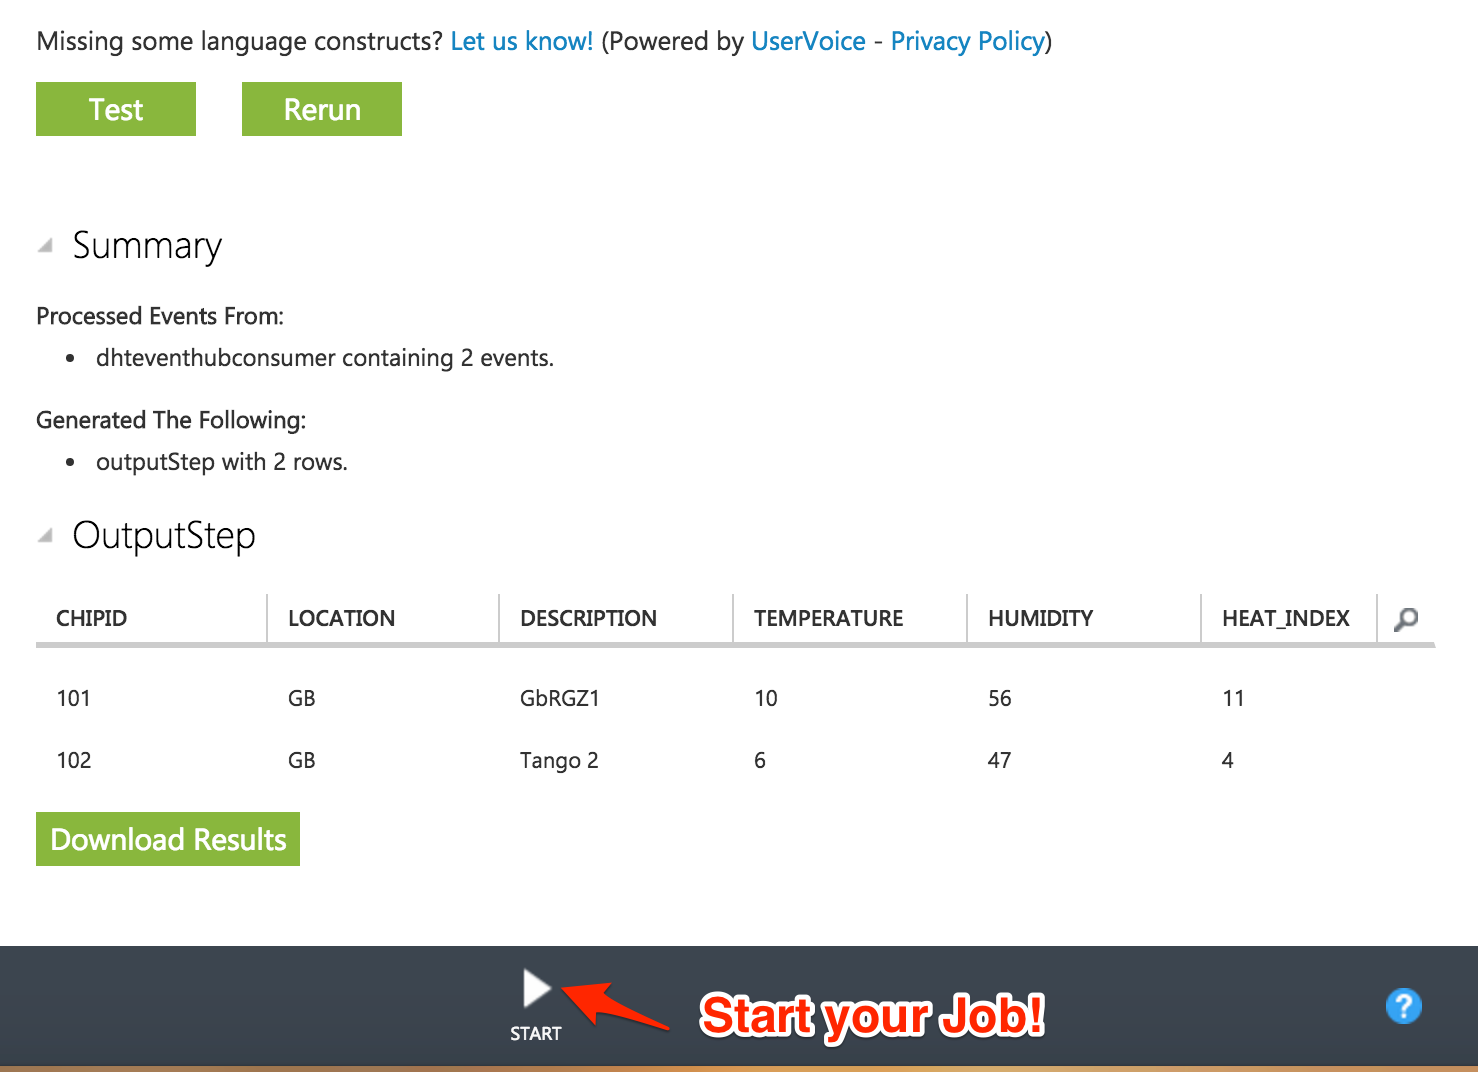
Congrats for coming this far, in the next blog we'll send data from IoT Gateway to Event Hub, query the DHTReadings table and we'll cap the project by doing some analytics with Power BI.
Next -> The IoT Gateway
References:
- https://azure.microsoft.com/en-gb/documentation/articles/event-hubs-csharp-ephcs-getstarted/
- https://azure.microsoft.com/en-us/documentation/articles/stream-analytics-get-started/
[bing_translator]