OMS Network Performance Monitor is now generally available
Summary: Microsoft Operations Management Suite Network Performance Monitor (NPM) has moved from preview mode to generally available status.
Hi folks, Abhave Sharma from the OMS team here. A few months ago we announced NPM in public preview. Since then, we’ve seen lots of users monitor their networks over the past few months and, working with customers, we’ve gathered a lot of great feedback. If you’ve been paying close attention over the past few weeks, you’ve seen a bunch of new additions to NPM. While we’re not done working to make NPM best in class, we’re ready and eager for everyone to get their hands on it.
Here’s a video that shows the GA announcement of Linux Management with Operations Management Suite:
What's changed since you first released the public preview?
A lot! In addition to a host of bug fixes, here are some of the new improvements:
ICMP-based tests: NPM now offers you a choice between Internet Control Message Protocol (ICMP) and TCP protocols to execute synthetic transactions that calculate network performance metrics, such as packet loss and link latency. This helps in cases where ICMP probing is needed. First, some intermediate nodes do not respond to TCP probes, for example, typically network devices. We can infer their existence based on the hop count of subsequent probes. Second, aggressive firewall configurations might be more restrictive to TCP-based probes than to diagnostic ICMP measurements, and firewall configurations might block the TCP reset packets that are needed to discover that probes have reached their destinations. Both limitations can also apply in the inverse, where ICMP probes are passively discarded by intermediate nodes or firewalls, where TCP probes would otherwise be permitted. This post provides guidance on selection of the right protocol for your environment.
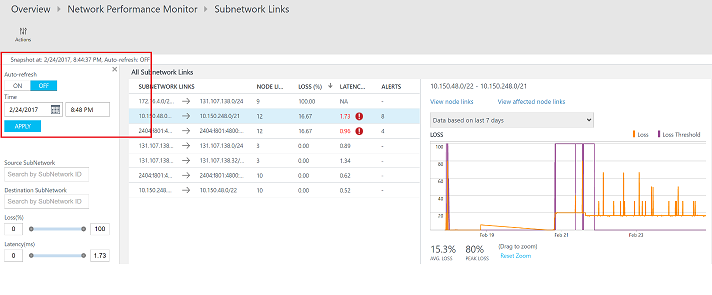
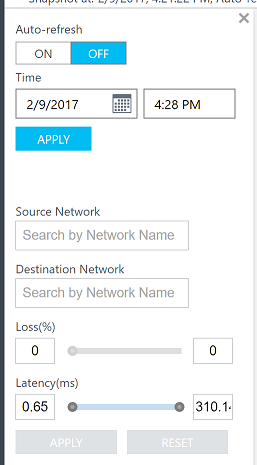
Network state recorder: NPM now lets you view the state of the network at any point in the past. To investigate a network connectivity incident that a user might have encountered last Friday night, select the date and time, and NPM returns the connectivity, loss, and latency status at that instant. You can also choose to enable or disable auto-refresh of any page while viewing the state. A bar, which is at the top of the page, shows the time for which the state snapshot is being displayed.
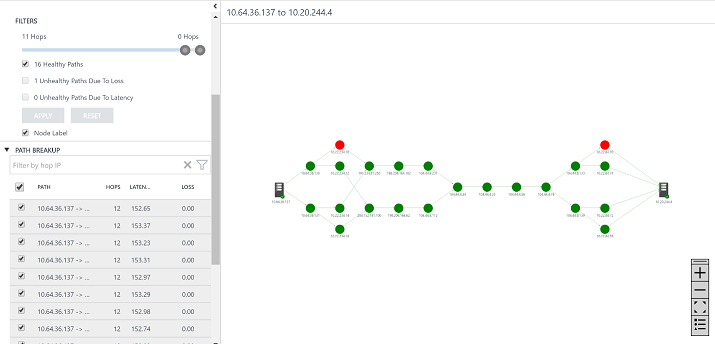
Updated topology map: We have enhanced the interactive topology map by improving its look and feel, enabling the filtering of paths by health status (for example, paths with a high loss), and adding advanced search capabilities. We’ve also added mechanisms to simplify viewing network topologies. You can use the slider control to hide the intermediate hops, which is especially useful when the details of the path through the core of the Internet aren’t of much concern to you.
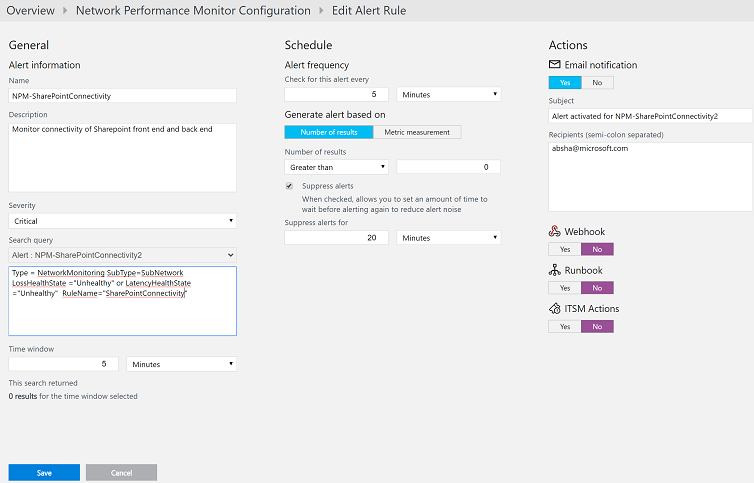
Improved alert management: NPM now takes advantage of the alert management capabilities in OMS. Users can now get email-based alerts, in addition to the existing alerts within NPM. Alerts can also be used to trigger remedial actions via runbooks or integrate with existing service management solutions by using webhooks. You can directly integrate your monitoring rules with OMS Alert Management by simply clicking Create Alert for the required monitoring rule. An alert rule will automatically be created. The cool thing is that the search query and other required parameters are automatically filled in. You can click Manage Alert to edit the alert settings.
Windows desktop support: NPM agents can now run on Windows desktops/client operating systems (Windows 10, Windows 8.1, Windows 8, and Windows 7), in addition to the previously supported Windows Server operating systems.
Search: Improvements in search enable quicker drill-down to the specific network and subnets that may be faulty, thereby enabling faster identification and remediation.
Wow, that's a lot! Does this mean you're done working on NPM?
Not at all! Network monitoring is a fundamental piece of IT operations, which means we’re constantly going to be improving the capabilities of NPM. Particularly, over the next few months, you’ll see us move aggressively to introduce a bunch of capabilities to provide a more cohesive network monitoring story.
I would like to try this immediately!
You can find detailed instructions about how to get started with Network Performance Monitor and monitor Azure, AWS, and on-premises networks using NPM.
Get a free Microsoft Operations Management Suite (#MSOMS) subscription so that you can start using NPM. You can also get a free subscription for Microsoft Azure. I invite you to follow the Microsoft IT Management Twitter and the Microsoft OMS Facebook site. You can also try a fully hydrated demo environment.
How can I give you guys feedback?
There are a few different routes to give feedback:
- UserVoice: Post ideas for new OMS Network Performance Monitor features to work on. Visit the OMS UserVoice page.
- Join our cohort: We’re always interested in having new customers join our cohorts to get early access to new features and help us improve NPM going forward. If you are interested in joining our cohorts, simply fill out this quick survey.
Abhave Sharma
Program Manager
Microsoft Operations Management Team