Monitoring a Busy Azure Automation Infrastructure (Part 1)
*Update - Here is a better, supported way to monitor Automation... Since this blog was written, Microsoft has released Log Analytics for Azure Automation.
Keeping Operations and our customers happy with telemetry
After finally making forward progress in the push to migrate our automation workflows from SMA to Azure Automation (AA) we’ve got several thousand jobs running every week in AA including our heavy hitter, an MSIT tool called Snooze.
Although there are a lot of big advantages of AA over SMA such as the ability to run native PowerShell, integration with DSC and the new availability of Webhooks, there are two problems that existed in SMA and are still around in AA: 1.) Detailed runbook telemetry and 2.) Ops support for monitoring and troubleshooting busy systems. First, telemetry – we got a bit of an upgrade with SMA, we now have the ability to filter through job history by state such as Success, Failed, Suspended, etc. The second bonus is that the high level dashboard view of job history comes in a pie chart which looks much prettier than that ugly old line graph we had in SMA.
The problem though, is that getting any meaningful data such as counts and amounts per runbook or the ability to search job history by runbook input parameters or their actual output is still missing. Using real data from our production environment as an example I see that there are 98 failed jobs of the 5,433 total. 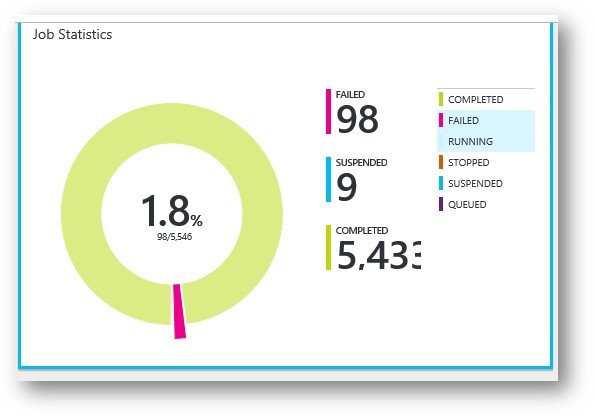
Not perfect, but that’s still less than a 2% failure rate. However, these 98 failures may have come from a particular workflow which was only run 100 times - then we’d have a 98% failure rate of a particular automation operation – not so great :/
I can easily filter my job history in the portal to focus on the failures. When I do that, I see that the failures were almost all from the Snooze runbook and they happened prior to our production switchover from SMA to AA – these failures occurred in test, whew! 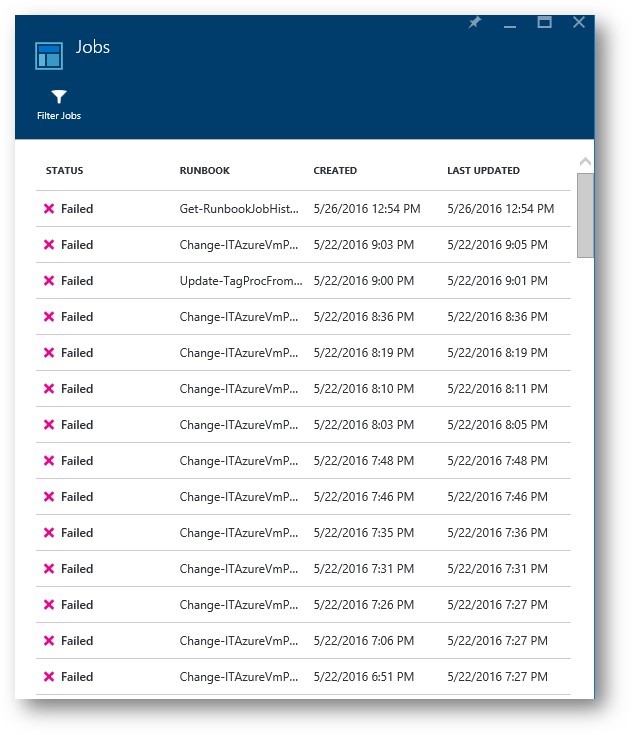
That is nice to know, but we aren’t completely out of the woods yet…
You see, these runbooks are called from a service sitting behind a web front-end and we do our best to make sure that they always return a result back to that front-end (FE) to let our customers know what the status of their request is. In order to make the best attempt to get these details to the FE, we need to ensure that any errors encountered are caught and handled properly before they can result in a state that puts the runbook in a Failed or Suspended state. We want to make sure that we never let the runbook die even if we hit an error that ultimately results in the failure of the end user’s request. The actual customer request results are formatted as json object and piped through the runbook job output where they can be retrieved by the FE.
This behavior hides the actual success/fail rates from AA so we cannot get a dashboard view of the customer’s experience. If we ran the service like this for any length of time, we’d only have customer escalations (or hopefully a lack there of) to gauge the health of our automation system. This certainly isn’t the way to drive customer satisfaction in a positive direction.
We also need to keep Operations happy and efficient for when the (hopefully trickle) of escalations come in, they are able to quickly identify the problems so they can be resolved. AA provides no mechanism to search historical job data for input parameters and job output. Let’s say that one of the 5,400 jobs submitted was for a server named \\guacamole on Monday evening and it failed. If Operations just started working on the issue today four days later on a Friday, they would have to manually flip through the hundreds of jobs that ran Monday evening looking through the job input and output properties of each until they found the one that referenced \\guacamole. In the Azure Portal, this is a mind-blowingly tedious process and chore that could take 30 minutes or more – just to find one failure. It’s the needle in a haystack of suck!
We simply could not run and manage a service this way, so we created a simple way to collect and store runbook job history in Microsoft SQL Azure. From this store of job history, engineers and Operations have quick access to details which would otherwise been hidden away and all but inaccessible – these are details which let us see the communication between our FE applications and AA such as runbook input parameters and output streams. We also collect start and stop dates and times, end runbook status, the credentials of who started each job and more. Now we are getting somewhere – we have a single location of data upon which we can enable Operations to work efficiently and upon which can build a great dashboard for truly accurate monitoring.
Next, I’ll go into details about how the solution to build the AA runbook job history data store was created in PowerShell and runs in AA itself with a Webbook also available to trigger a collection cycle to get up-to the minute information as needed. See Part 2 here: Monitoring a Busy Azure Automation Infrastructure (Part 2)