Creating a Quiz Web application using SharePoint designer - Part 5
Building our results page – a journey into XSLT formatting!
So far we have built a page to display our available Quizzes (default.aspx) and passed variables from that page via a query string. The receiving page is ShowQuestion.aspx which displayed the question and allowed the user to give the answer, which in turn created a new Answer list item and then moved onto the next question.
Once the final question has been answered the user is directed to the ShowResults.aspx page. Here will we show the final mark and if the user has passed or failed (depending on the PassMark variable that is in each Quiz list item, seems like a long time ago since we built those tables doesn’t it?)
We passed two variables across into our final page, Title and Session.
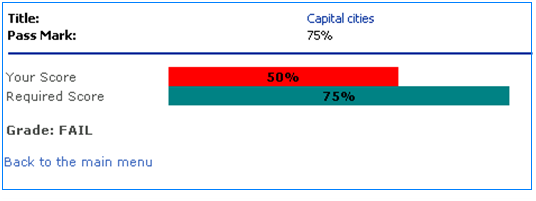
We want the ShowResults.aspx page to show the details of the Quiz and let the user know their score (expressed as a percentage) and if they have passed or failed. In time honoured tradition we will also graphically show how the final score compares with the required score.
Here is how it will look when completed.
Setting up the page layout
Just like our ShowQuestion.aspx page we are going to use two web part zones for our results page (this page is going to be much more straightforward to build however).
Let’s get started. Open up our blank ShowResults.aspx page and click inside the form and press return a few times to make some space. Now we need to add two web part zones and put two data views in them, like this.
1. From the menu Insert | SharePoint controls | Web Part Zone
2. Insert | SharePoint controls | Data View
We will separate the two zones with a horizontal line. To add the line go to the top right task pane, click on the ToolBox tab and then Drag a “Horizonal line” into the form below the Web Part zone.
Finally, insert a second Web Part Zone below the line (don’t add a data view of the moment).
You should now have two web part zones inside separated by a horizontal line. The top zone is ready to be configured as a Data View.
Show the Quiz information
Our top section will display the Quiz title and pass mark. To do this we need to link the data view web part with the Question list and then filter it to show the correct Quiz using the Title value that we passed in the query string.
Follow these steps:
1. Click on the uppermost web part
2. In the top right task pane click on the “Data Source Library” tab
3. Click on “Questions” and “Show data”
4. Control and Click on “Title” and “Pass Mark”
5. Select “Insert selected fields as...” and choose “Single item view”
You should now see the Quiz and Pass mark displayed. Again we need to filter this view to only show the Quiz that matches the Title parameter. Follow these steps:
1. Select the uppermost web part and click on the OUUI
2. Click on “Parameters
3. Click “New parameter”
4. Name=Quiz
5. Source=Query String
6. Variable=Title
7. Default=Enter the name a test Quiz here so that you will see some data in the view
8. OK
9. Click on “Filter”
10. Click “Add new.....”
11. Make a criteria where the Field name is “Title” is equal to [Quiz]
You will need to change the format of the Pass Mark field to show as a percentage (Right click, format as Number, percentage)
Build the Answers Section
Now we have the Quiz information displayed correctly we need to build our second Web Part which will contain information taken from the Answers list.
We will pass some information from the Quiz table (the pass mark and the number of Questions) so that we can calculate the final score for the user. and will filter our view of the answers to only include information from the current session (using the Session= parameter from the query string.
Firstly let’s insert our second Data View Web Part:
1. Highlight the second empty Web Part Zone
2. From the menu select Insert | SharePoint Controls | DataView
3. In the Data Source pane (top right) select the “Answers” list and click “Show Data”
4. Insert the “MarkAnswer” feild into the Data View as a “Multiple item View”
Currently the DVWP will be showing all of the items in the Answers table. We need to filter for our current session only.
1. Click on the OOUI for the Web Part and select “Parameters”
2. Click “New Parameter” with a name of “Session”
3. Source=Query String
4. Variable=Session
5. Leave the default value blank
6. OK
7. Click on Filter then select “Click here to add a new ...”
8. Make a clause than the field name “SessionID” equals [Session]
9. OK
Try taking a Quiz and see how the ShowResults.aspx page currently looks. You should have the Quiz information shown at the top and below a list of 1’s and 0’s corresponding each question you took (and depending if you got it right or not).
In a moment we are going to transform those ugly 1’s and 0’s to a nice looking chart. Before we do we just need to make a couple more values available to our second web part. We need to pass values of the number of questions and pass mark from our Quiz part. Here is how:
1. Click on the OUUI of our Quiz (uppermost) web part
2. Click Web Part Connections
3. “Send row of Data to”
4. “Connect to a web part on this page”
5. Target Web Part: Answers
6. Target action: Get parameters from
7. Click on the “inputs to Answers” column and create a parameter called “NumberOfQuestions”
8. Click on the Columns in Quiz column next to “NumberOfQuestions” and choose the field “Number of Questions”
9. Click on the “inputs to Answers” column and create a parameter called “PassMark”
10. Click on the Columns in Quiz column next to “PassMark” and choose the field “PassMark”
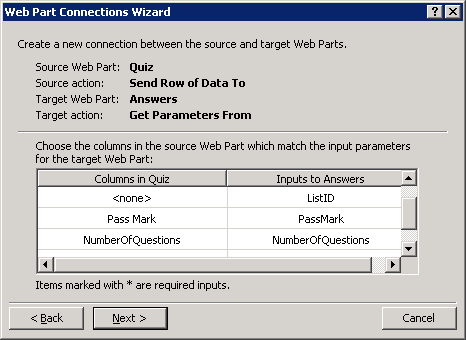
This has sent our two extra parameters across ready for use in the Answers data view web part.
Fun with XSLT (or how to build display SharePoint data in interesting ways)
I have tied to avoid talking too much about XSLT and XSL (mainly because I don’t know enough about it!) but we can’t avoid it any longer.
SharePoint stores pretty much everything in SQL database tables, when we query the data it is returned as XML and finally displayed in HTML. SharePoint uses XSTL (eXtensible Stylesheet Transformation Language) to transform the XML to HTML. A much better explanation of XSLT is available here.
SharePoint designer knows all there is to know about XSLT and has helpers to assist you in building statements. A great way to get familiar with the power of XSLT is to look how the designer itself inserts it (for example take a look at the code behind conditional formatting clauses or how Data View tables are rendered).
To add our final part to the ShowResults.asp we are going to cut and paste some code rather than have a step by step guide. The reason for this is that much of code below was created manually rather than using the designer – I will however explain the key elements.
Cut and Paste time
A standard Data View Web Part uses a number of XSLT templates in order to render a table full of data. There is a seperate XSL template for the table header, the body, the row and the footer. Our table can be much more simple as we only want to display three lines of information: The required score, the user’s score and the grade.
Highlight the Answers DVWP and take a look at the code. You will be able to see the associated <xsl:template> sections for the table.
Delete them all, and replace with the following code:
<xsl:template name="dvt_1">
<xsl:variable name="dvt_StyleName">Table</xsl:variable>
<xsl:variable name="Rows" select="/dsQueryResponse/Rows/Row"/>
<xsl:variable name="HowManyCorrect"
select="count(/dsQueryResponse/Rows/Row[normalize-space(@MarkAnswer)='1'])" />
<xsl:variable name="PercentMark" select="(100 div $NumberOfQuestions) * $HowManyCorrect"></xsl:variable>
<xsl:variable name="RequiredScore" select="$PassMark * 400"></xsl:variable>
<table border="0" width="100%" cellpadding="2" cellspacing="0">
<tr valign="top">
<th class="ms-alignleft" nowrap="" style="width: 143px">Your Score</th><th
nowrap="" width ="{($PercentMark*4)+1}px" >
<xsl:attribute name="style">
<xsl:if test="$PercentMark >= ($PassMark*100)">background-color: #008000;</xsl:if>
<xsl:if test="$PercentMark < ($PassMark*100)">background-color: #FF0000;</xsl:if>
</xsl:attribute>
<strong><xsl:value-of select="$PercentMark" />%</strong>
</th>
<th nowrap="">
</th></tr>
</table>
<table border="0" width="100%" cellpadding="2" cellspacing="0"><tr valign="top"><th class="ms-alignleft" nowrap="" style="width: 143px">Required Score</th><th nowrap="" width="{$RequiredScore}px" bgcolor ="teal">
<strong><xsl:value-of select="$PassMark*100" />%</strong>
</th><th nowrap="" ></th></tr></table>
<table border="0" width="100%" cellpadding="2" cellspacing="0"><tr valign="top"><th class="ms-alignleft" nowrap=""><strong><br />Grade:
<xsl:if test="$PercentMark >= ($PassMark*100)">PASS</xsl:if>
<xsl:if test="not($PercentMark >= ($PassMark*100))">FAIL</xsl:if>
</strong></th></tr></table>
</xsl:template>
That’s looking a bit smarter isn’t it (although I will leave it up to you to get the formatting just right).
Let’s take a look at what we just did.
Counting matching list values and display charts in XSLT
Firstly we removed the all XSTL templates in the data view and added just one back in: dvt_1
We have already defined many parameters (getting them from the Query string and from the Quiz list) and so we just need to create a couple more working variables.
First off we need to run through all the list items in our set (the ones matching our Session value in the Answers list) and count how many of them have the MarkAnswer field set to a ‘1’. In other words we need to count have many questions the user got right. Here is the line that does this:
<xsl:variable name="HowManyCorrect" select="count(/dsQueryResponse/Rows/Row[normalize-space(@MarkAnswer)='1'])" />
Next we want to convert the number correct into a percentage. To do this we need to know the total amount of questions in the Quiz which we passed across from the Quiz list.
<xsl:variable name="PercentMark" select="(100 div $NumberOfQuestions) * $HowManyCorrect"></xsl:variable>
We use this variable to decide how long the score bar will appear. I decided to used a fixed bar with 100% being 400 pixels wide. We change the width value of the cell depending on the value of the score like this:
<th class="ms-alignleft" nowrap="" style="width: 143px">Your Score</th><th nowrap="" width ="{($PercentMark*4)+1}px" >
I added the “+1” to the value so that if the user gets a zero score then the bar is still displayed.
There is also some conditional formatting applied to the colour of the score bar. If the user has passed it is green, if not it is red. This is done by comparing the score with the pass mark for the exam and setting the cell background colour value like this:
<xsl:attribute name="style">
<xsl:if test="$PercentMark >= ($PassMark*100)">background-color: #008000;</xsl:if>
<xsl:if test="$PercentMark < ($PassMark*100)">background-color: #FF0000;</xsl:if>
</xsl:attribute>
Next we want to create a bar showing the % value required to pass the exam. I decided to have 100% equal a fixed length of 400 pixels. To determine the length of the bar I used this formula:
<xsl:variable name="RequiredScore" select="$PassMark * 400"></xsl:variable>
For a more complex example of XSLT formatting of SharePoint data, there is a good aticle here a full tutorial of XSLT laguage is available here.
One last thing...
To give our users a route back to main menu where they can select another Quiz add the following:
Click below your second web part and from the menu Insert | Hyperlink
Text to display: Back to the main menu
Address: default.aspx
And finally, don’t forget to link the ShowResults.aspx to your master page (from the menu, Format, Master Page, Attach Master Page).
It’ all over – some final thoughts, tips and possible modifications
I really hope you have enjoyed building this web application. Currently it is fairly basic but there are a number of simple modifications that could be added, such as:
· A link on the results page for the User to review the questions and Answers
· Adding an “explanation” field into the Questions list
· Allowing multiple section answers
If you have a lot of users running your Quizzes you will find a large amount of entries in the Answers list. Storing each answer separately can in fact be very useful as you can analyse the responses to particular questions at a very granular level.