Exploring Microsoft Antimalware Alert in Azure Security Center
Azure Security Center leverages Microsoft Antimalware engine to trigger antimalware related alerts such as the one shown below:

While this alert brings awareness about the current threat status, which in this case it was remediated, sometimes you want to know more information about the threat itself (threat name, process, etc). You can use the Search functionality in Security Center to launch Log Analytics and query your workspace for more information on that. Follow the steps below to do that:
1. Click Search in Security Center dashboard
2. Select the workspace that you are using.
3. Under the Run button, click Advanced Analytics option.
4. Click the plus sign to open a new tab:

Now you can start your query by using the sample below:
ProtectionStatus
| where ThreatStatus contains "remediate"
Keep in mind that this query’s result might be long, and ideally you should also filter by computer’s name to narrow it down to the computer you want to know more details about the threat that was remediated. Also, there are many columns available in this table, if you want to focus only on the relevant ones, change your query to:
ProtectionStatus
| where Computer contains "WS2016VM"
| where ThreatStatus contains "remediate"
| project DeviceName , Threat , ThreatStatus , ThreatStatusDetails , ThreatStatusRank , ProtectionStatus , ProtectionStatusRank , ProtectionStatusDetails
Here an example of this output:
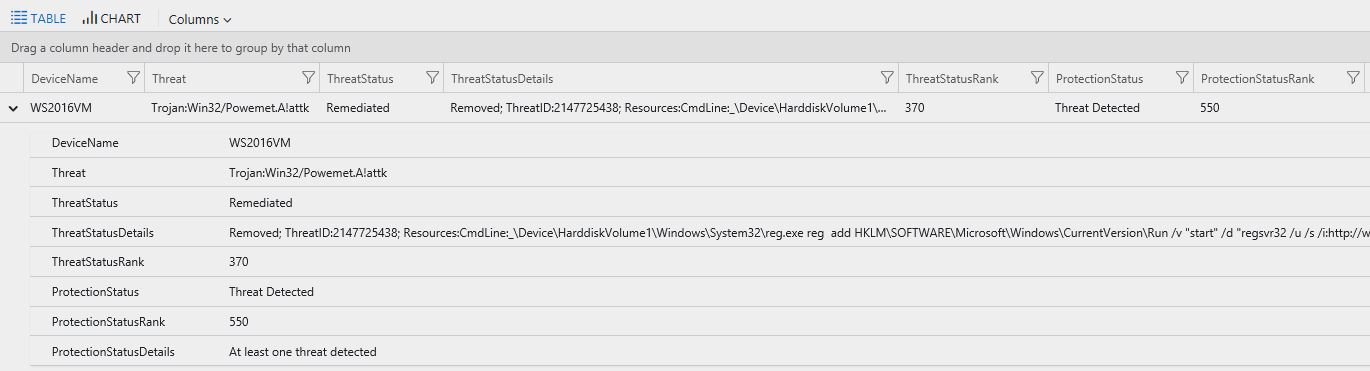
Notice that the output for ThreatStatusRank and ProtectionStatusRank are numbers. These numbers have specific meaning. Use the table below as reference to interpret those numbers:
| Threat Status | Rank |
| Active | 550 |
| Unknown | 470 |
| Remediated | 370 |
| Quarantined | 350 |
| Blocked | 330 |
| Allowed | 250 |
| No threats detected | 150 |
| Protection Status | Rank |
| Threat Detected | 550 |
| Unknown | 470 |
| Not Reporting | 450 |
| Action Required | 350 |
| No real time protection | 270 |
| Signatures out of date | 250 |
| Real time protection | 150 |
The rank is grouped into segments:
- 100s = protection in place
- 200s = some, but insufficient protection in place
- 300s = action required to remediate a threat
- 400s = action required to collect data
- 500s = infection found
Conclusion
As you could see througout this post, using Azure Security Center to visualize antimalware alerts is good, but if you need to dig deeper and better understand what that alert was about, you can leverage Log Analytics to search those alerts. If you want to test this on a lab environment, make sure to use our security alerts playbook. One of the steps on this security playbook is to download EICAR malware test file, and once you perform this action, you should be able to see an alert similar to the one showed in this post.