Another Case of High CPU Utilization by wspsrv.exe on Forefront TMG 2010
1. Introduction
I had this article almost ready way back when I was on Forefront TMG Team but never had time to finish. This is about an issue where wspsrv.exe process was consuming high CPU in random moments of the day and the only workaround to make this process to use less CPU was to restart Firewall Service. Maybe the behavior sounds familiar, but the final resolution was never documented here in this blog.
2. Gathering Data
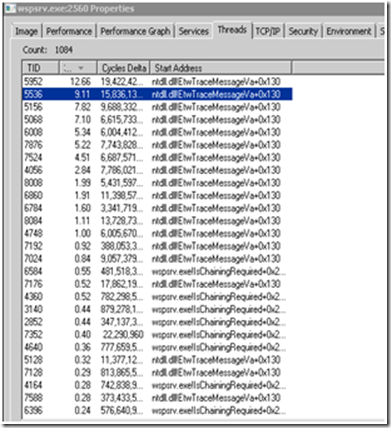
Using Process Monitor was possible to see that there were lots of ETW Trace threads running as shown below, which was kind of interesting to me:
To move forward in this investigation the usual perfmon and dump of the wsprv.exe process were collected while the issue was happening.
3. Analyzing the Data
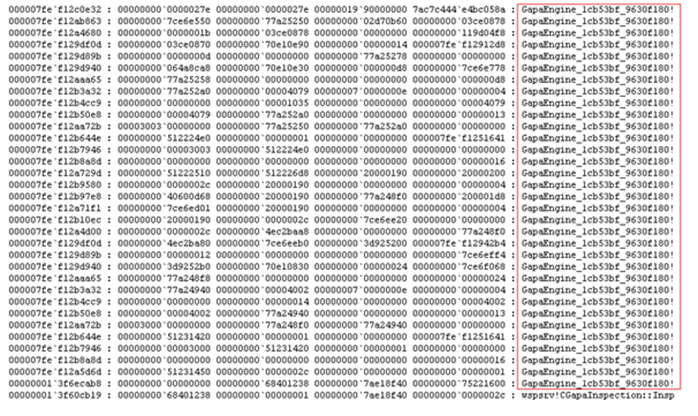
Using the same approach that I documented in the Troubleshooting Forefront TMG 2010 Performance issues Cheat Sheet it was possible to notice a pattern in the threads that were stuck in Critical Section , all of them had a similar stack as shown below:
At that point it was clear to me that the component involved in such behavior was NIS, because is NIS that uses GAPA Engine (read NIS white paper for more information). As a test we disabled NIS and restarted Firewall Service and as a result of this action the issue stopped occurring.
4. Conclusion
Of course this was not the solution, as we don’t want to permanently disable this feature, but at least confirmed that NIS was the component causing the issue. We enabled NIS again and the issue came back. Another set of dumps and Process Monitor analysis lead the investigation to confirm that verbose tracing was enabled causing NIS to impact wspsrv.exe process by consuming more CPU. The traces are:
- GAPA = HKEY_LOCAL_MACHINE\SOFTWARE\Microsoft\Network Inspection System\WPP\Components\GAPA
- NIS = HKEY_LOCAL_MACHINE\SOFTWARE\Microsoft\Network Inspection System\WPP\Components\NIS
The value possible values are: 0, 1, 2, 3 and 4 corresponding to Error, Warning, Info, Function and Noise, respectively. In this case it was 4, which indeed caused a lot of noise. The resolution was to change back to zero and restart firewall service. It is important to clarify that is not always that this behavior will happen when the lower level trace is high, in order words, don’t think you can always repro this issue by just increasing this value. The issue was a combination of factors, in this particular scenario the server was very busy and by having the lower level trace so high the CPU utilization was increasing. The overall recommendation is to increase this value only for troubleshooting purpose and decrease after collecting data.

