New Options on TMG Data Packager
1. Introduction
TMG Data Packager is part of the new TMG BPA that is already available for download and on this new release the Data Packager has some additions to cover new features of the product. What? You don’t know what the Data Packager does? Ok, so review the articles below before continue to read this post:
Using ISABPA for Proactive and Reactive Work with ISA Server – Part 1 of 2
Using ISABPA for Proactive and Reactive Work with ISA Server – Part 2 of 2
2. New Additions
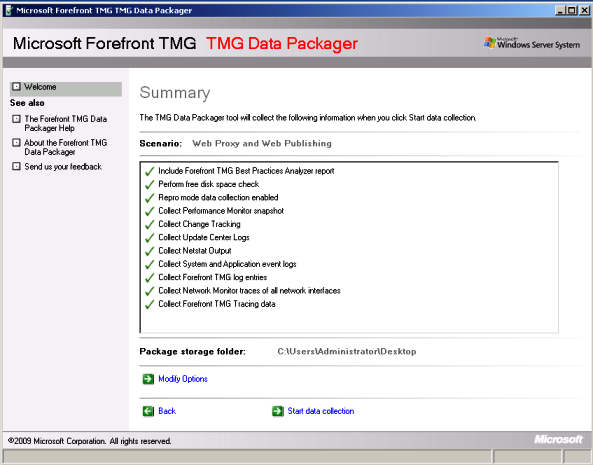
When you select a template, such as Web Proxy and Web Publishing and click Next, you will notice that the new interface shows a comprehensive checklist of the options that are selected by this template as shown below:
When you click Modify Options you will see the new additions, highlighted below:
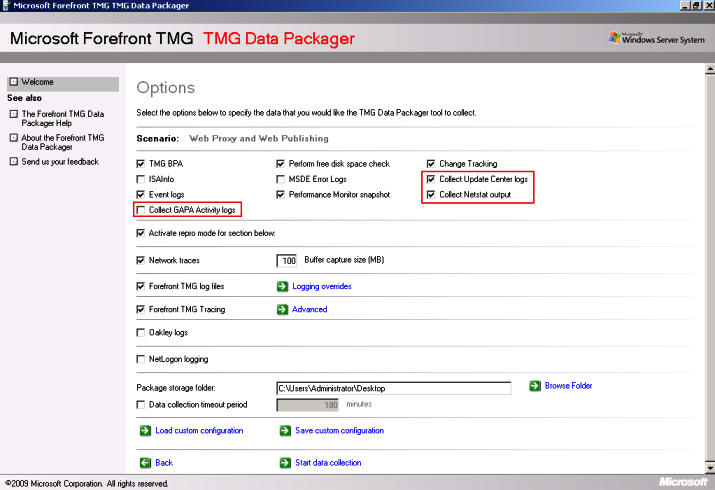
The new options are:
· Collect GAPA Activity Logs: this option collects the files GapaActivityFirewall.etl, GapaActivityWebProxy.etl and GapaSigStub.log. Those files can help troubleshooting NIS issues.
· Collect Update Center Logs: this option collects the files ISA_UpdateAgent.log, WindowsUpdate.log and MpSigStub.log. Those files can be used to troubleshoot issues related to update center, such as NIS or Malware Inspection update.
· Collect Netstat Output: this option collects the netstat result and save to a file called NetStatOutput.txt, this file can be used for many scenarios and here it is an example of one.
3. Do I need more than that?
Usually TMG Data Packager is enough for the most scenarios, however with the additions of new features in TMG there are some cases that you might need to collect more data in order to move forward in your analyzes. One additional log that you can enable to troubleshoot some types of URL Filtering issues (such as updates from MRS) and Update Center in general, is the winhttp trace. To enable this log you can use the following command line:
netsh winhttp set tracing trace-file-prefix="C:\Temp\wlog" level=verbose format=ansi state=enabled max-trace-file-size=1073741824
After enable this log, restart Firewall Service, reproduce the problem and disable the trace by using the command below:
netsh winhttp set tracing trace-file-prefix="C:\Temp\wlog" level=verbose format=ansi state=disabled max-trace-file-size=1073741824
Note: to run this command you need to open CMD with elevated privileges.
Another useful logging is the WSTrace, which is available after downloading and installing the Windows SDK. The WSTrace can be enabled by opening the Windows SDK Command Shell (under All Programs\Microsoft Windows SDK v7.0\CMD Shell) with elevated prompt and running the commands below:
wstrace.bat create verbose
wstrace.bat on
wstrace.bat dump > C:\Temp\wwstraces.csv
After finishing reproduce the problem, switch to the Windows SDK Command Shell command shell and type the commands below:
Press CTRL+C and press ENTER until the batch file terminates
wstrace.bat off
wstrace.bat delete
4. Conclusion
While troubleshooting TMG issues keep focus on the problem that you are trying to fix, at the same time that is good to have a variety of logs in hands to analyze, don’t use it all unless you really need it. Keep things simple, troubleshooting should start from the most obvious things and move to the most deep inside analyzes, never the opposite.