Capturing an User Mode Crash on ISA Server – Part 1 of 2
1. Introduction
The previous post was about performance and some of the symptoms that can confuse us during the problem definition. This post will be about a crash on a user mode process, in this case for the process ISA Process wspsrv.exe.
2. Scenario
Usually, when this process crashes we have the following event on the application log:
Event Type: Error
Event Source: Microsoft Firewall
Event Category: None
Event ID: 14057
Date: DATE
Time: Time
User: N/A
Computer: MyISA
Description:
The Firewall service stopped because an application filter module C:\Program Files\Microsoft ISA Server\Module generated an exception code YYYYYYY in address XXXXXX when function ZZZZZZZ was called. To resolve this error, remove recently installed application filters and restart the service.
Where:
· Module – module that generated the exception.
· YYYYYYY – Exception code, for example an access violation (C0000005).
· XXXXXX – memory address where the exception occurred.
· ZZZZZZZ – function that was called during the exception.
When the Firewall Service crashes it causes the ISA Server to stop working and the following event will appear on the application log:
Event Type: Error
Event Source: Microsoft ISA Server Control
Event Category: None
Event ID: 14079
Date: DATE
Time: TIME
User: N/A
Computer: MyISA
Description:
Due to an unexpected error, the service fwsrv stopped responding to all requests. Stop the service or the corresponding process if it does not respond, and then start it again
3. Gathering Data
The big problem when this kind of event happens is that when you realize that the issue occurred then it is already too late. The root cause was already gone and you just lost the chance to grab the data.
Since we are dealing with a crash we need to attach a debugger to the process that is crashing. The program that we are going to use to do this is called DebugDiag and it was created by the IIS Team to troubleshoot inetinfo.exe crashes and leaks. Later on became a robust tool to grab and analyze user mode hangs and crashes for IIS or other processes. First thing to do is to download the DebugDiag from the link below:
After install the tool on the ISA Server then follow the steps below to configure:
1. Click Start / Programs / Debug Diagnostic Tool 1.1 / DebugDiag 1.1 (x86) . The following window will appear:
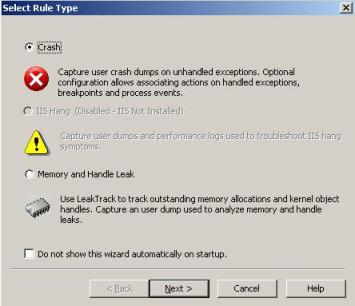
Figure 1 – Creating a new crash rule.
2. Leave the Crash option enabled and click in Next. The following window will appear:
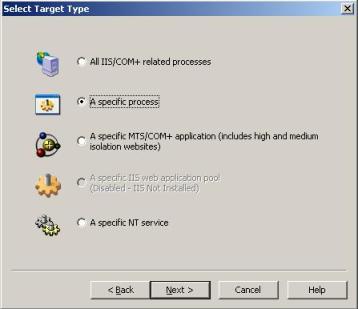
Figure 2 – Target object.
3. Select the option “A specific process” and click in Next. The following window will appear:
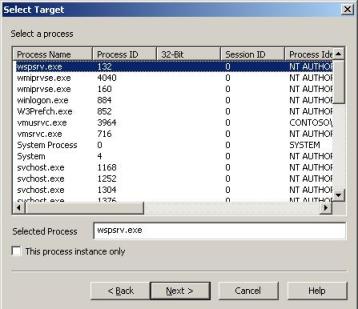
Figure 3 – Selecting the process.
4. Select the ISA Server process that is crashing. For the purpose of this example I’m going to select the process wspsrv.exe. Click in Next and the window below will appear:
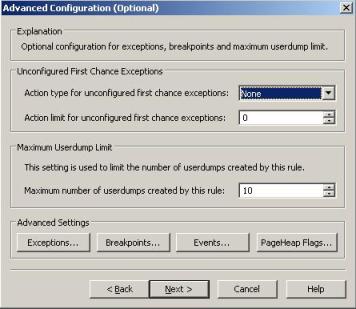
Figure 4 – Advanced configuration.
5. On this window we need to select a couple of things, let’s check below:
· Action type for unconfigured first chance exception: Full Userdump.
· Action limit for unconfigured first chance exception: 0 (unlimited).
6. Click on the exception button and select the options as showed below and on the same order:
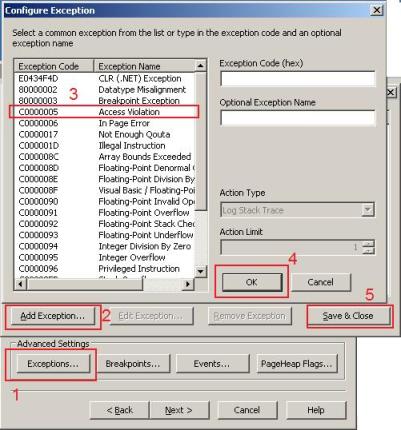
Figure 5 – Final steps.
7. Notice that we select the “Access Violation” exception as an example, because the event 14057 in this case was the C0000005. If you are not sure which exception is happening, you don’t need to select anything here and the Debugdiag will capture the dump regardless of the exception. Click in Next to continue.
8. Type the name of rule and click in Next and then click in Finish to activate the rule.
4. Now what?
Now we just need to wait for the next occurrence and the debugger with catch the crash. Next post will show how the crash dump looks like and what to do after you have it.