How to collect a good boot trace on Windows 10 or Windows Server 2016 using WPRUI.
Applies to:
Windows Server 2016
Windows 10
Windows Server 2012 R2
Windows 8.1
Windows Server 2012
Windows 8.0
Ok, so you went through my old pal Jeff Stokes post:
How to collect a good boot trace on Windows 7
https://blogs.technet.microsoft.com/jeff_stokes/2012/09/17/how-to-collect-a-good-boot-trace-on-windows-7/
Note: Windows 10 ADK/SDK WPT is not compatible w/ Windows 7 SP1 or Windows Server 2008 R2 SP1.
https://blogs.technet.microsoft.com/yongrhee/2017/11/13/windows-10-adksdk-wpt-is-not-compatible-w-windows-7-sp1-or-windows-server-2008-r2-sp1/
So how do you go about doing that in Windows 10 or Windows Server 2016?
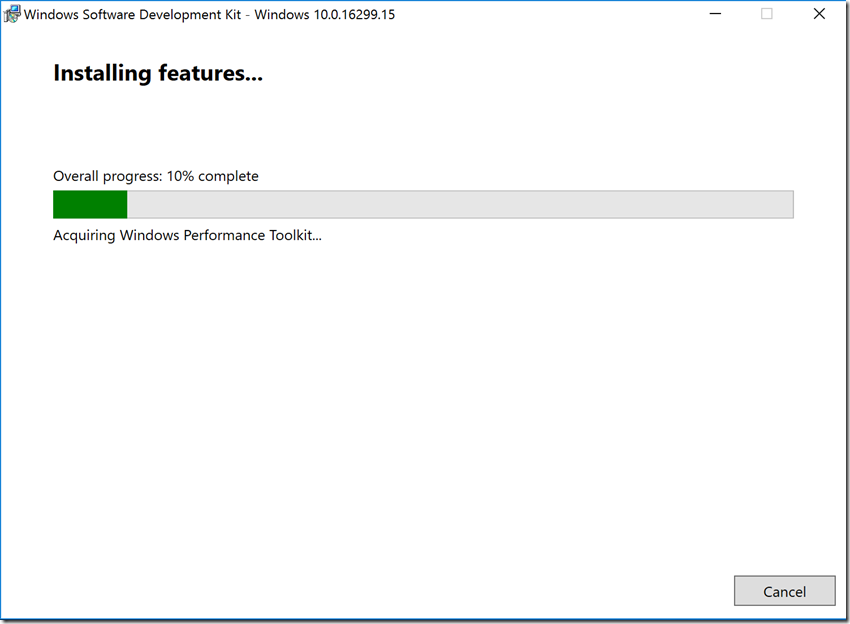
Step 1. Install the Windows 10 SDK
https://developer.microsoft.com/en-US/windows/downloads/windows-10-sdk
Click on "Download the .EXE"
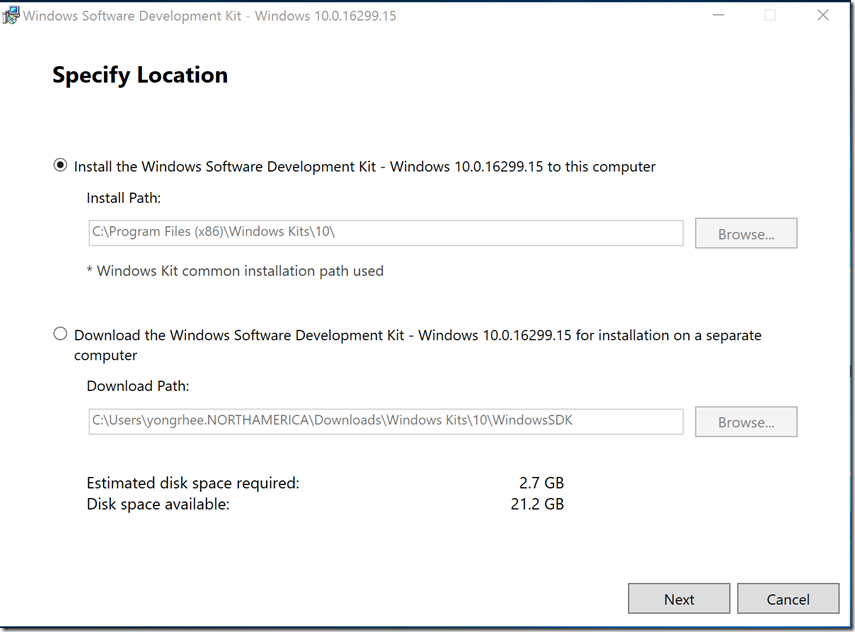
Select the radio button for “Install the Windows Software Development Kit”
Click on “Next”
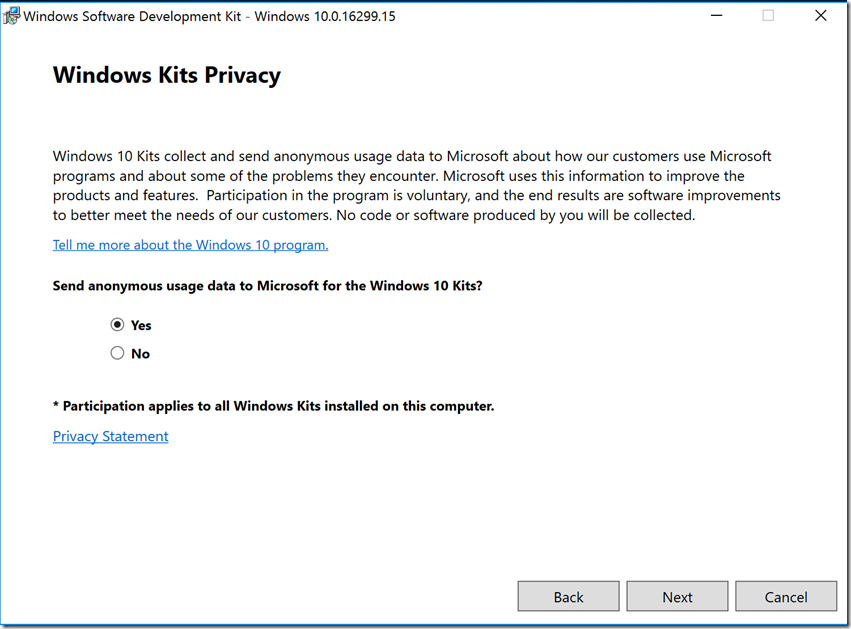
Select the radio button “Yes”
Click on “Next”
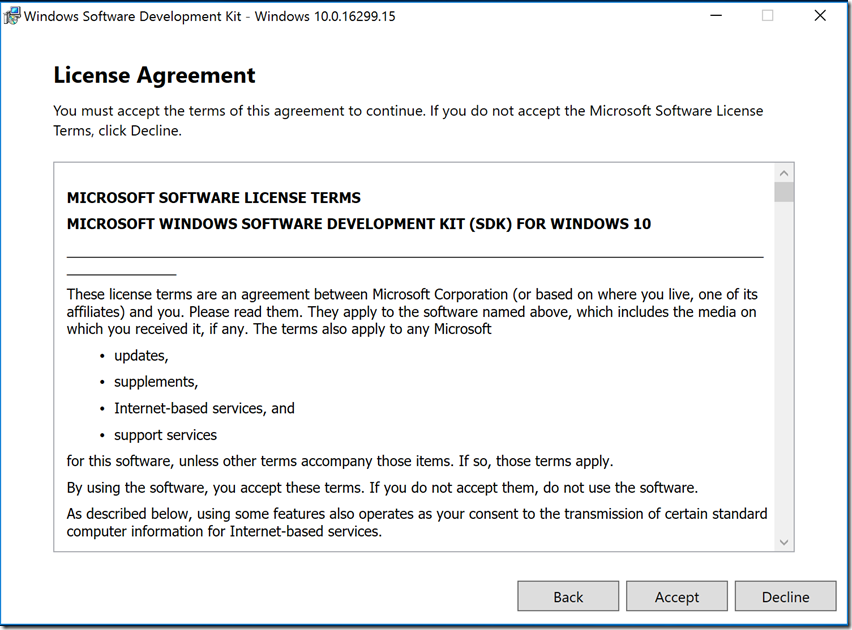
Click on “Accept” to the EULA.
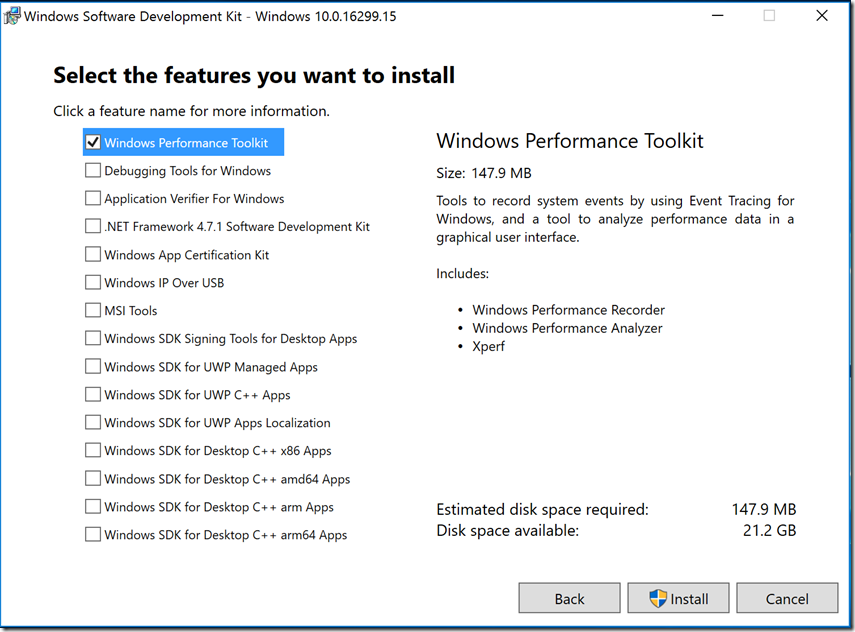
Select the check box for “Windows Performance Toolkit”
Click on “Install”
Click on “Close”
Step 2. If capturing on a Hyper-V VM, make sure that you have the following unchecked:
Under “View”, uncheck “Enhanced session” otherwise you will get two (2) Winlogon phases which will throw your analysis off.
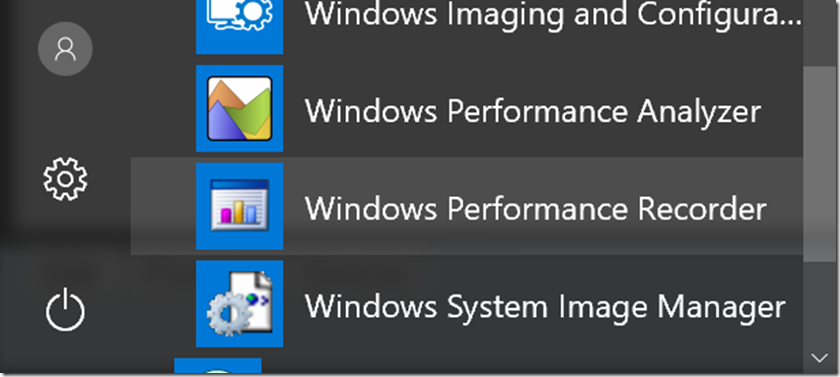
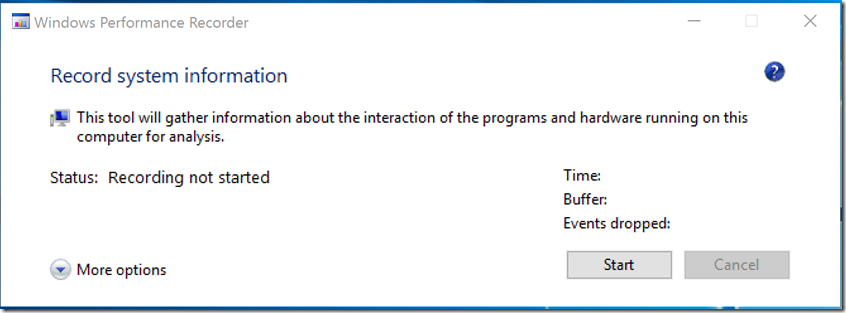
Step 3. Start the “Windows Performance Recorder” GUI (WPRUI.exe)
WARNING: Before proceeding, save any data.
Note: You need to be a “Local Admin”
For example, if your end-users are Domain users, you will need to temporarily add the the Domain user account to the Local Admin security group.
Note 2: Make sure that the domain user or local user is in the right OU (for User policies and login scripts).
Note 3: Make sure that the machine account is in the right OU (for Computer policies and startup scripts)
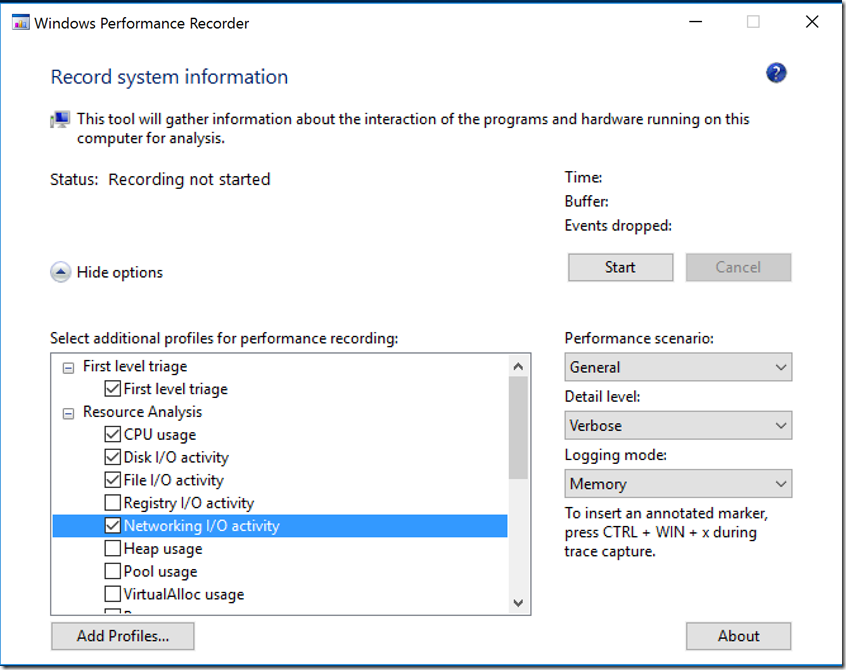
Click on the drop down “More options”
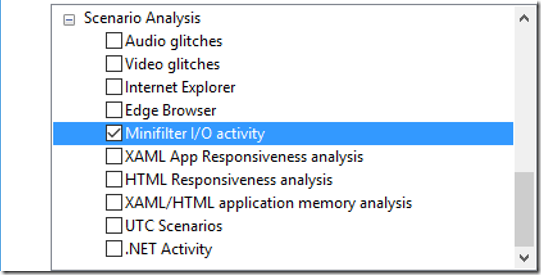
Expand “Resource Analysis”
Check the boxes for:
“CPU Usage”
“Disk I/O activity”
“File I/O activity”
“Networking I/O activity”
“Minifilter I/O activity”
You might want to check on “File I/O activity” but I usually do it on a 2nd pass, because it seems ‘heavy’.
Same thing w/ “Registry I/O” activity. If a 3rd pass is required, I will capture it then.
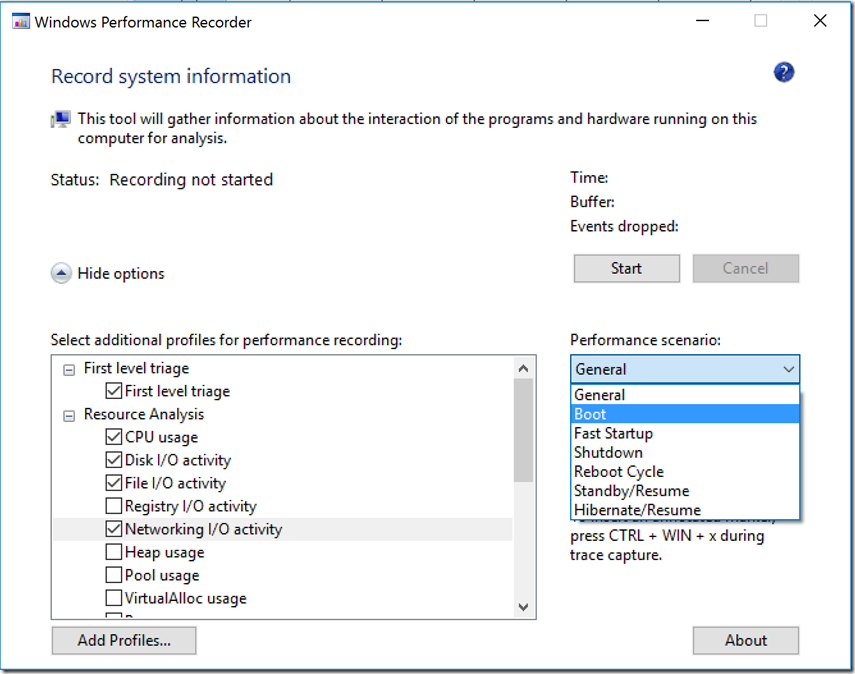
Under “Performance Scenario”
Select “Boot”
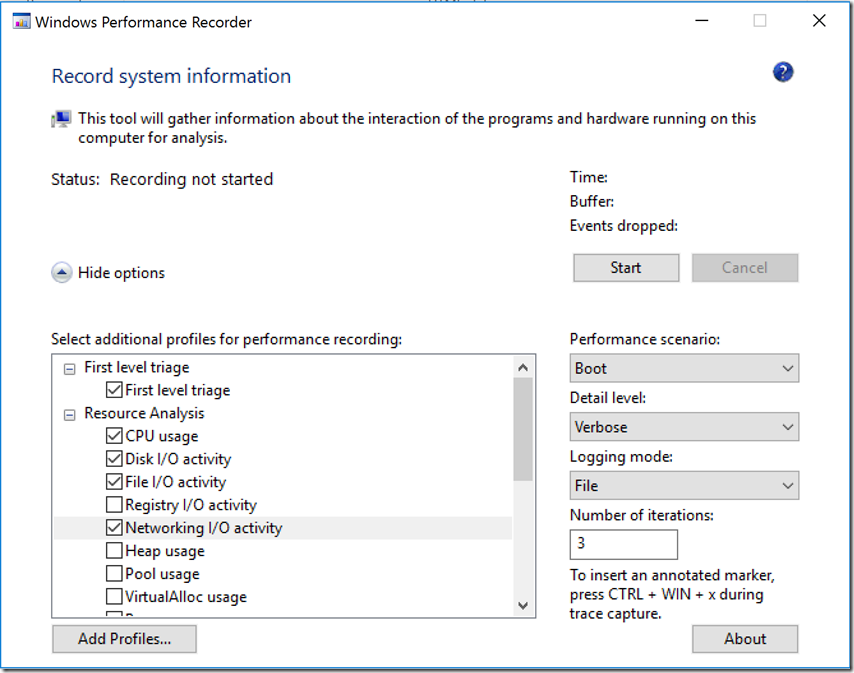
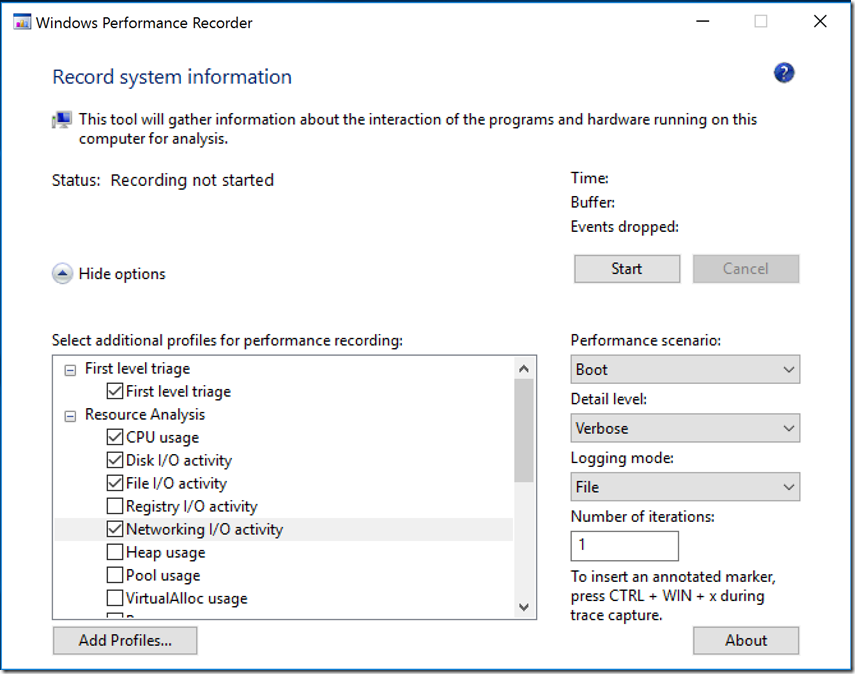
Under “Number of iterations” change from 3 to 1.
and
The end result should look like the screen shot above.
When ready to reproduce the issue, click on “Start”.
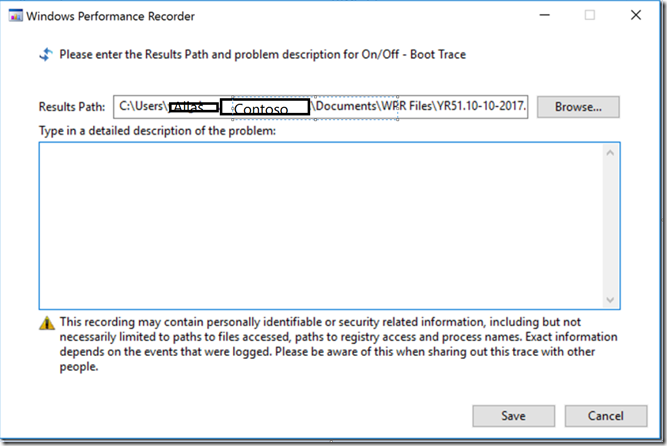
Note 4: If you are using folder redirection or roaming profiles, change the “Results Path:" to the local disk drive such as c:\temp
Note 5: If you have a separate physical disk such as D: or E: drive, put the “Results Path:" there.
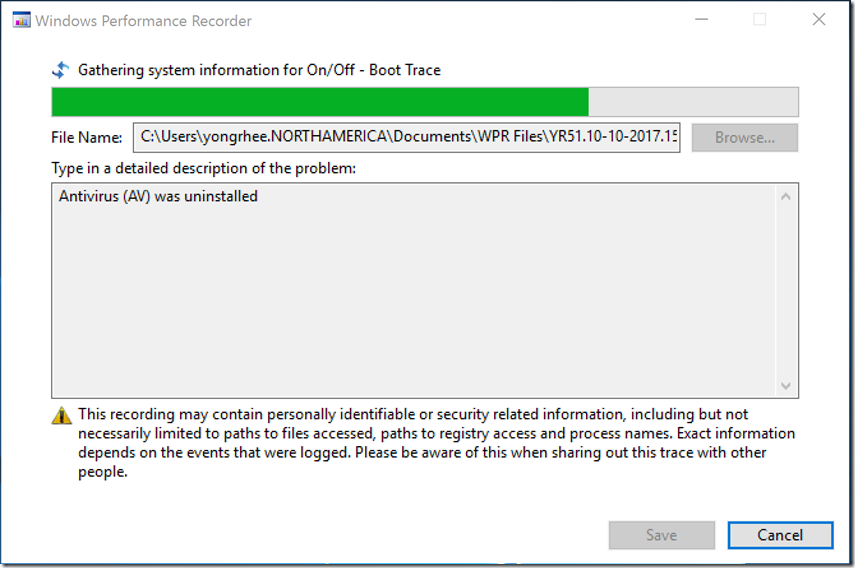
Note 6: In the “Type a detailed description of the problem”:
Type in information that is relevant, such as:
Example 1:
All applications installed
Example 2:
Antivirus (AV) was uninstalled
Example 3:
AV and DLP were uninstalled
Example 4:
AV, DLP, and Host Intrusion Detection System (HIPS) were uninstalled
Your last prompt before the machine is rebooted.
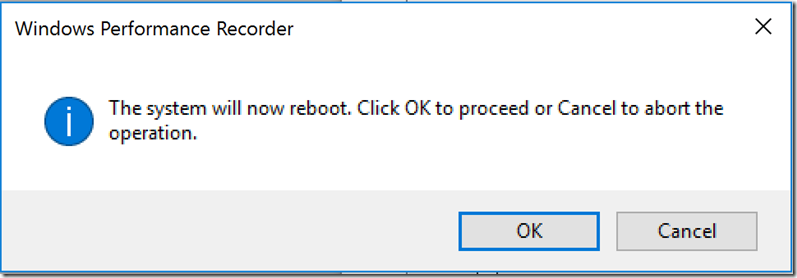
When you are ready, click on “OK”
WARNING: Your system will reboot within 5 seconds. Save any data.
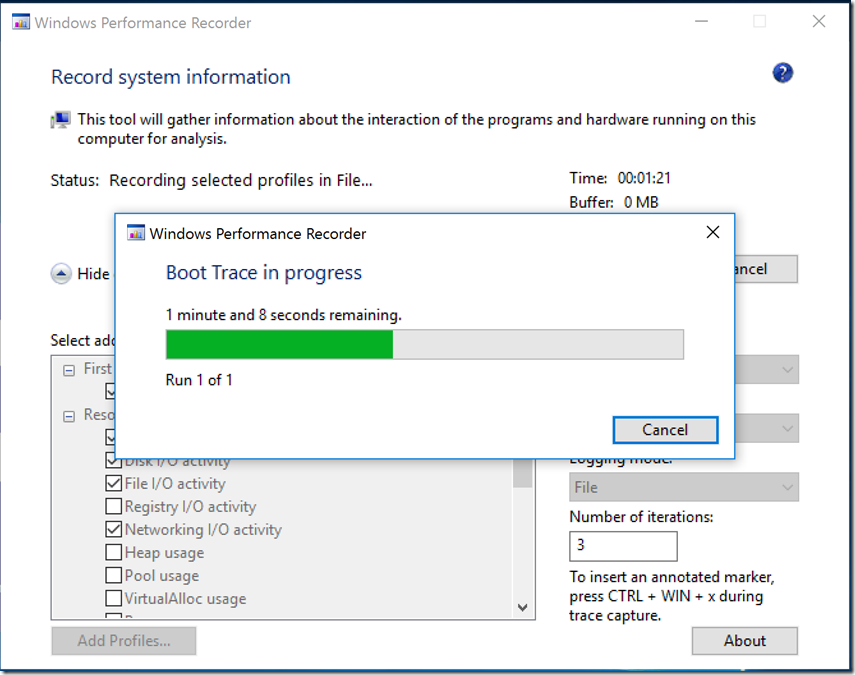
TIP: Once your system reboots, login as soon as possible
There will be a 2 minutes (240 seconds) count countdown once you login.
TIP: If this screen doesn’t show up, make sure that you are logging in with an account that has Local Admin rights.
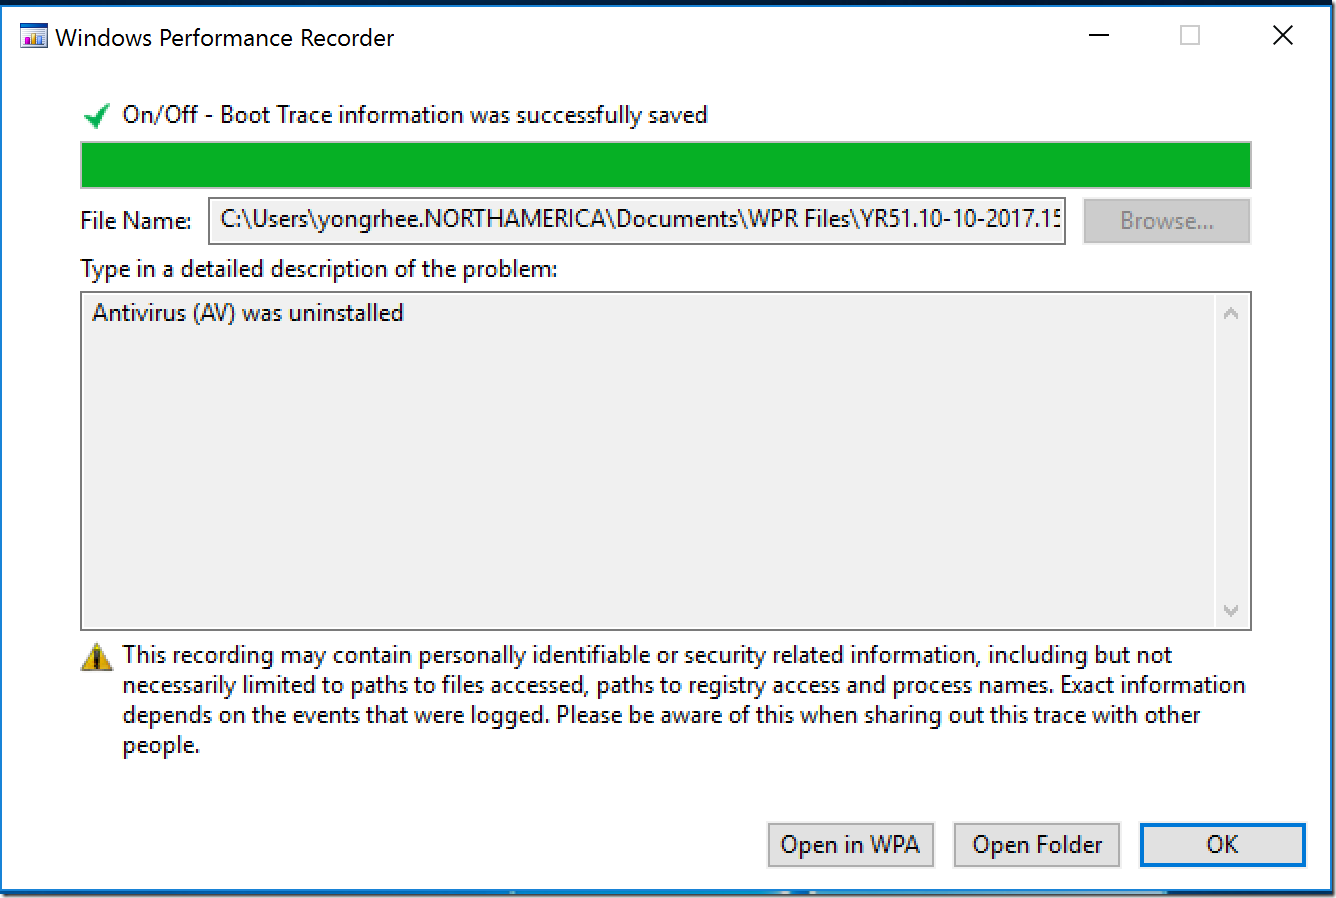
Click on “Open Folder”
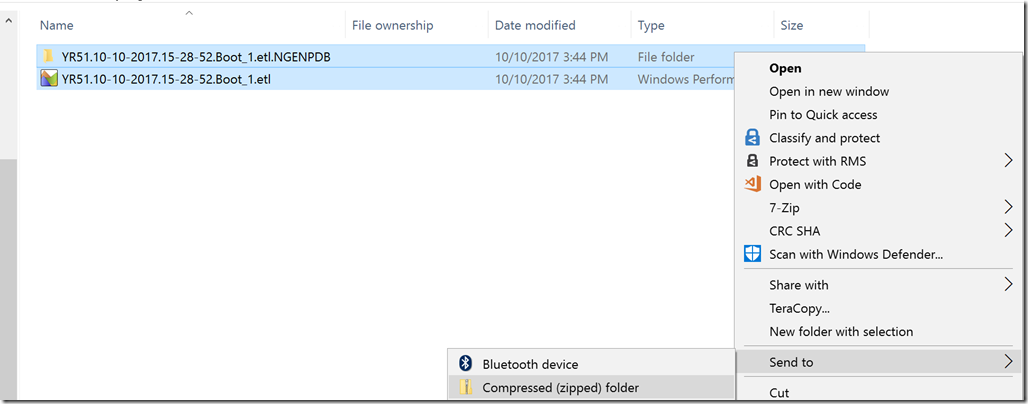
Select the .etl file and the NGENPDB folder, zip it up, it will compress nicely.
I hope this helps,
Yong
