How to troubleshoot a handle leak using ETW (WPRUI/WPR/Xperf) tracing?
Applies to:
Windows Server 2016
Windows Server 2012 R2
Windows Server 2012
Does not apply to:
Windows Server 2008 R2
Windows Server 2008
Windows Server 2003
The reason is, the handle etw tracing wasn’t added to the Windows OS kernel until Windows Server 2012.
For these older OS’es the following still works:
How to troubleshoot a handle leak?
https://blogs.technet.microsoft.com/yongrhee/2011/12/19/how-to-troubleshoot-a-handle-leak/
How to troubleshoot a handle leak using ETW* tracing?
* WPRUI/WPR/Xperf
Today, one of our customers in Texas was having an issue with W3WP.exe leaking handles of the type “Event” (Event handles).
Note: Not to be confused with “Event logs”.
In my opinion it’s (Event handles) the most long running one to troubleshoot because it doesn’t leave any ‘bread crumbs’ to easily piece together based on a static user mode dump.
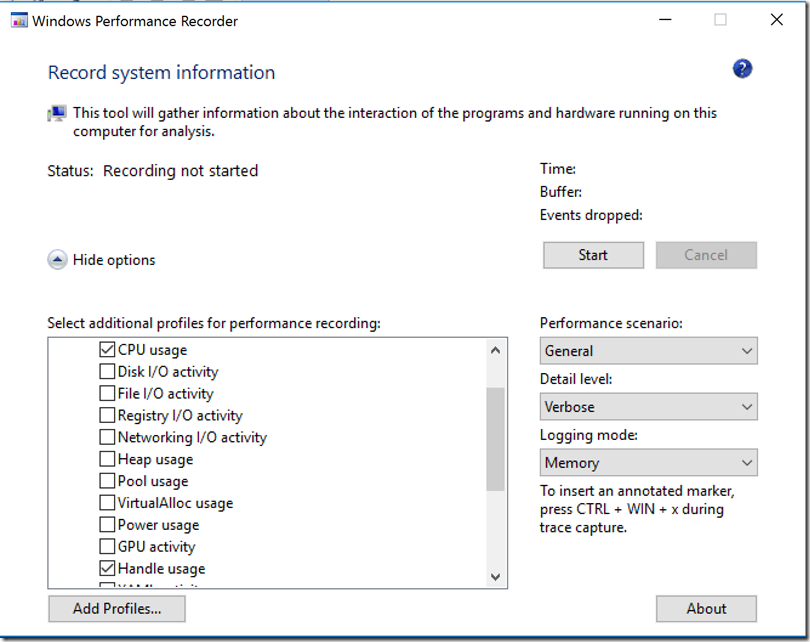
If we were able to reproduce the issue, then we could just use WPRUI.exe or WPR.exe
Check the box for “Handle Usage”
I personally like to add “CPU Usage” to everything that I collect because I’m able to see the code that was running on the CPU.
Change the Logging mode: from “Memory” to “File”
Click on “Start”.
The only problem was the issue would take 24 hours or more to reproduce.
One of the limitations with WPRUI and WPR are that you cannot collect circular logging.
The tool that can do that is xperf.exe.
Perusing the internet, there was no documentation on how to enable handle usage.
=== Start of PerfTrigger_Start.cmd ===
:: Change drive to c:
c:
:: Change folder to where the “Windows Performance Toolkit” is installed.
cd "c:\Program Files (x86)\Windows Kits\10\Windows Performance Toolkit"
xperf -on Proc_Thread+Loader+Latency+DISPATCHER+ob_handle+ob_object -stackwalk CSwitch+ReadyThread+ThreadCreate+Profile+handlecreate+handleclose -BufferSize 1024 -MinBuffers 1410 -MaxBuffers 4096 -MaxFile 8192 -FileMode Circular -f e:\temp\kernel.etl
::Note – Where E: is the drive where you have 8 GB+ of free disk space.
=== End of PerfTrigger_Start.cmd ===
=== Start of PerfTrigger_Stop.cmd ===
::Reproduce the issue
:: Stop and merge the etl trace
xperf.exe -d c:\temp\%computername%_Handle_leak.etl
=== Stop of PerfTrigger_Stop.cmd ===
You could use something like Perfmon Alerts to call the syntax above when the process, in this example, w3wp.exe reaches 10,000 handles.
The challenge with automating w3wp is that there are more than 1 instance.
On the next post, I’ll talk about how to analyze the data when you have the .etl trace file.
Thanks,
Yong Rhee
