How to setup a local network trace using “Start Local Trace” in Message Analyzer v1.3?
Applies to:
Windows 10
Windows Server 2012 R2
Windows 8.1
Windows Server 2012
Windows 8
Windows Server 2008 R2
Windows 7
Does not apply to:
Windows Server 2008
Windows Vista
Windows Server 2003
Windows XP
In this blog post, we will be using the ‘new method’ of taking a local network trace in your Windows system.
Back in “Network Monitor 3.4”, it was fairly simple to start a network trace. With feedback from you, the customer, our Message Analyzer (MA) product group added a new feature called “Start Local Trace”.
Step 1. To install Message Analyzer, here is a step-by-step instruction:
Step 2. Before you capture any network trace, here are questions you should have ready when you are capturing it:
Network tracing (packet sniffing) data to provide when troubleshooting.
Step 3. How much memory does it use during a network trace capture?
The installation requirements and requirements are documented here: Installing and Upgrading Message Analyzer
Step 4. Minimize the noise.
Close all the applications that are unnecessary for the issue that you are investigating.
Step 5. Clear any caching that has been done.
Clear all name resolution cache as well as all cached Kerberos tickets.
To clear DNS name cache you type in: IPConfig /FlushDNS
To clear NetBIOS name cache you type in: NBTStat -R
Note: This command requires you to be a “Local Aministrator” (i.e. CMD ( Run as admin)).
To clear Kerberos tickets will need KList.exe: KList purge
Note: Depending on what permissions the service or application has, you might have to open a Command Prompt (CMD.exe) using those permissions. For example: If the app or service uses the System account, you will need to use Sysinternals Psexec.
PSExec.exe -s -i cmd.exe
And then run the commands above in the new command prompt that opened to clear the cache(s).
i.e. If you are troubleshooting Internet Explorer (IE), clear the IE cache.
Step 6. Starting the network trace capture.
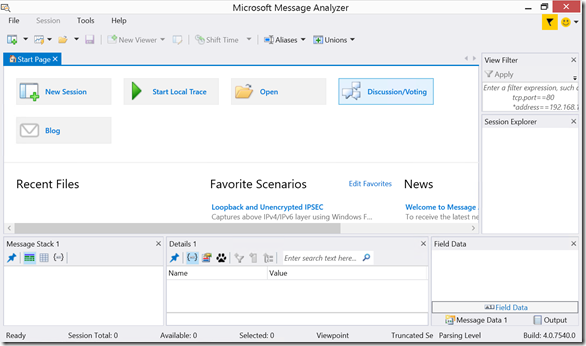
Right click on “Message Analyzer”
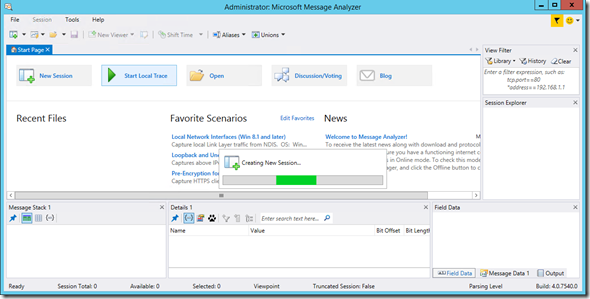
Click on “Run as administrator”Click on “Start Local Trace”
You will see “Creating New Session” flash by.
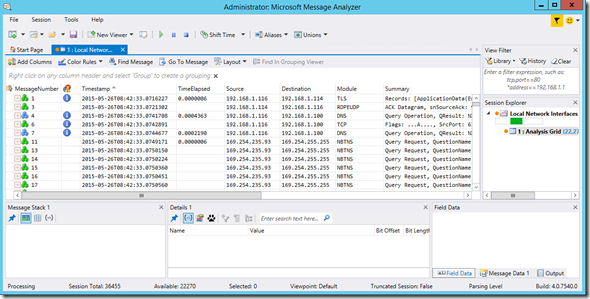
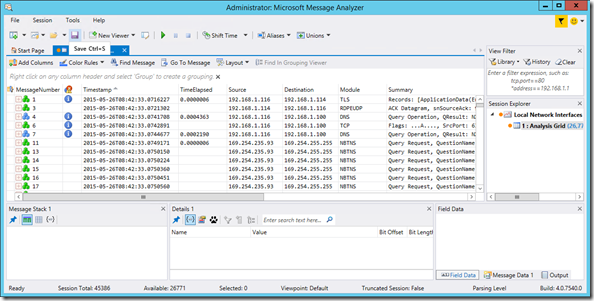
You will notice that under “Session Explorer” > “Local Network Interfaces” a green bar is moving across.
And you should also notice the message numbers start to fill out.
Step 7. <Reproduce the issue>
TIP: Make the repro as simple and short as you can make it.
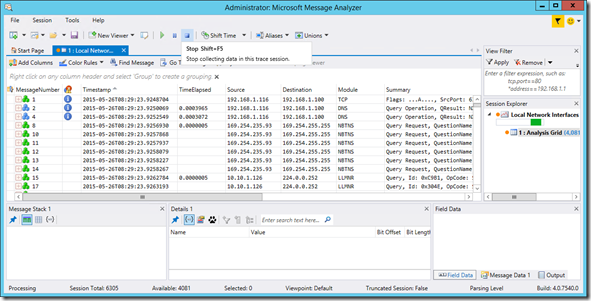
Step 8. When you are ready to stop the network trace:
Click on the “Stop” icon (or press Shift+F5).
Step 9. When you are ready to save the network trace:
Click on the “Save” icon (or press CTRL+S).
Click on “Save as” and add a name to your network capture.
Or
If you are going to be using it in Wireshark or still want to use Network Monitor 3.4 (Netmon), click on “Export” and add a name to your network capture.
Step 10. If you have a ‘working’ repro, repeat the steps, so that it helps when analyzing the data set. It will make that needle in the middle of a hay stack be a little bit more visible.
If you are sharing the network trace, make sure to provide a detailed description of what was occurring when the network trace was taken, include screen shots if you can.
Yong
References:
Microsoft Open Specifications Support Team Blog
Message Analyzer has Released – A New Beginning
Introduction to Network Trace Analysis Using Microsoft Message Analyzer: Part 1
Introduction to Network Trace Analysis Using Microsoft Message Analyzer— Part 2
Introducing the Netlogon Parser (v1.0.1) for Message Analyzer 1.1
Troubleshooting Basics for the Netlogon Parser (v1.0.1) for Message Analyzer
Troubleshooting TLS1.2 and Certificate Issue with Microsoft Message Analyzer: A Real World Example
So you want to use Wireshark to read the netsh trace output .etl?
Microsoft Message Analyzer Operating Guide
