How to collect Winsock (AFD) logging for Windows Vista, 7, 8 and 8.1 and Windows Server 2008, 2008 R2, 2012, and 2012 R2
Applies to:
Windows Server 2012 R2
Windows 8.1
Windows Server 2012
Windows 8.0
Windows Server 2008 R2
Windows 7
Windows Server 2008
Windows Vista
When troubleshooting an application that is having network issues, you might be asked to collect Winsock (AFD) traces, in parallel to a Network Trace, and IPconfig.txt.
Starting in Windows Vista and Windows Server 2008, we added an Event Trace for Windows (ETW) provider for Winsock (AFD).
ETW provider: Microsoft-Windows-Winsock-AFD
ETW provider GUID: E53C6823-7BB8-44BB-90DC-3F86090D48A6
You might want to capture a Winsock (AFD) trace in order to try troubleshooting the issue you are experiencing.
There are 4 out of 6 methods to collect this information:
Method 1: Enable AFD logging using the perfmon GUI
Note: The benefit, it’s built-in to the O.S.
1. Open Perfmon
2. On the left under “Data Collector Sets”
3. Right-Click “Startup Event Trace Sessions”
4. Choose “New”->”Data Collector Set”
5. Type “Winsock-AFD” and click Next
6. Click Add
7. Wait for the dialog to populate and choose “Microsoft-Windows-Winsock-AFD” and click ok
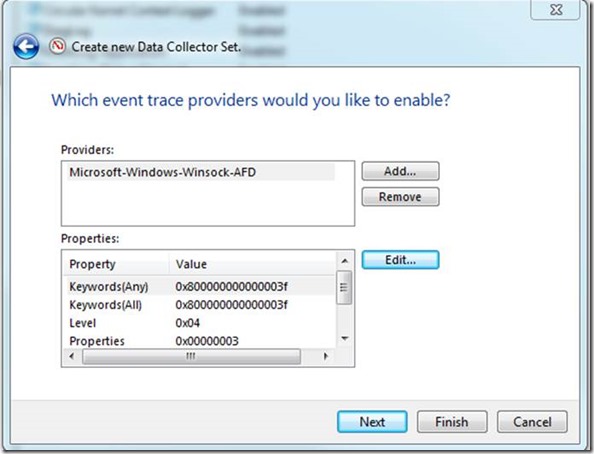
8. In the Properties Dialog select each item and click edit
9. Enable all check boxes and for the level type 4
10. It will look something like the following.
11. Click Next and specify the path to save the data
12. Click Finish
13. Right-Click Winsock-AFD and choose “Start as Event Trace Session”
14. <Reproduce the issue.>
15. On the left under “Data Collector Sets”
16. Click “Event Trace Sessions”
17. Right-Click Winsock-AFD and choose “Stop”
18. This will produce a Winsock-AFD.etl file
Method 2: Enable AFD logging using the perfmon command line (logman.exe)
Note: The benefit, it’s built-in to the O.S.
1. Start, CMD (Run As Admin)
2. C:
3. MD c:\logfile
4. CD c:\logfile
5. Logman.exe start Winsock-AFD -p Microsoft-Windows-Winsock-AFD 0x800001000000007f win:Verbose -bs 64 -nb 256 256 -max 1024 -mode circular -o c:\logfile -ets
6. Note: -p <provider> [flags or keywords] [level]
7. <Reproduce the issue>
8. Logman.exe stop Winsock-AFD
Method 3: Enable AFD logging using xperf.exe (a part of the Windows Performance Toolkit).
Note: You could download the latest version as of when this blog was posted here: WPT: Updated version of “Windows Performance Toolkit” from Windows 10 Technical Preview ADK or SDK
Note: The benefit, if you want to get a matching kernel xperf, you can combine this command.
1. Start, CMD (Run As Admin)
2. C:
3. MD c:\logfile
4. CD c:\logfile
5. xperf -start Winsock-AFD -on Microsoft-Windows-Winsock-AFD:0x800001000000007f:0x5: 'stack ' -BufferSize 64 -MinBuffers 256 -MaxBuffers 256 -MaxFile 1024 -FileMode Circular -f c:\PreMerge_Winsock-AFD_%ComputerName%.etl
Note: -on <provider> [flags or keywords] [level]
6. <Reproduce the issue>
7. xperf -stop Winsock-AFD -d c:\logfile\Winsock-AFD_%ComputerName%.etl
Method 4: Enable AFD logging using “WPRUI or WPR”
One of these days, as time permits.
Method 5: Enable AFD logging using “Message Analyzer”
One of these days, as time permits.
Method 6: Enable AFD logging using Tracelog.exe (a part of the Windows Development Kit (WDK, used to be known as the Windows “Driver Development Kit” (DDK)).
Note: The benefit, it has the most options.
1. Open an elevated command prompt.
2. Create a folder off the root of C: called “Logfile”
3. Run the command “tracelog -start Winsock-AFD -guid #E53C6823-7BB8-44BB-90DC-3F86090D48A6 -flags 0x800001000000007f -level 5 -b 64 -min 256 -max 256 -cir 1024 -f c:\logfile\Winsock-AFD_OutPutLogFile_%ComputerName%.log” and press enter.
4. Reproduce the issue.
5. Type “tracelog -stop” and press Enter
6. Grab the logfile from c:\logfile\Winsock-AFD_OutPutLogFile_%ComputerName%.log”
Note: The default location of the logfile is C:\Windows\System32\logfiles\
Additional data that you want to collect: (Not optional)
Collect IPconfig /all
1. Click Start
2. Click Run
3. Type CMD and press enter
4. Type “IPconfig /all > c:\logfile\ipconfig.txt” and press enter
5. Close the command prompt
You will also want to gather a Network trace on this machine so that you or we can correlate the timing of the issue to the log file.
Additional data that you want to collect: (Optional, if you don’t want to connect the dots)
- Perfmon
- WPRUI/WPR/Xperf
Zip up all the data.
Yong Rhee
Reference(s):
===========
Event Tracing for Windows and Network Monitor
