Hyper-V and VHD Performance - Dynamic vs. Fixed
My name is Tim Litton, I work as a Program Manager within the Microsoft Windows Server team, and my particular area of focus is performance optimization for Hyper-V.
With the recent release of Hyper-V, customers are starting to ask us how to configure Hyper-V to get the best performance. It’s generally recognized that there is overheard running a virtualized environment, but the question that really needs to be answered is how much?
With this in mind, I thought I’d share some of our recent testing of Hyper-V and how disk workloads perform when using Fixed or Dynamic VHDs. The goal here is to provide some data that backs up the tuning guidance that can be here: https://www.microsoft.com/whdc/system/sysperf/Perf_tun_srv.mspx.
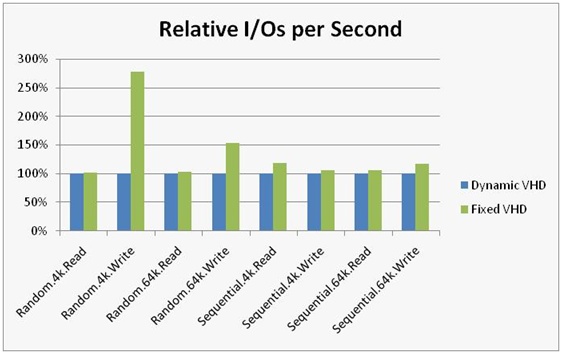
The following graph shows the relative performances for a number of different scenarios (with Dynamic VHD being the baseline).

Fixed VHD always performs better than a Dynamic VHD in most scenarios by roughly 10% to 15% with the exception of 4k writes, where Fixed VHD performs significantly better.
We ran 16 virtual machines when performing these tests (see “How We Tested” below) with the goal of evaluating how well Hyper-V performed in the server consolidation scenario. Being able to consolidate a number of physical machines onto a single machine and have the virtual machines able to handle the load is a very important design goal for Hyper-V.
The exact result that a customer is going to see will depend on quite a few variables (e.g. how large and often the reads and writes are, how many outstanding I/O there can be at one time), so performing real-world testing is the best way to assess what impact virtualization will have.
Recently, QLogic published a benchmark for I/O throughput for storage devices going through Windows Server 2008 Hyper-V (https://www.qlogic.com/promos/products/hyper-v.aspx) that closely matches the native performance, thus demonstrating Hyper-V’s ability to bring the advantages of virtualization to large-scale datacenters.
How We Tested
Hardware: DP DL580 G5, 16 x 2.4 GHz (Intel E7340), 16 GB RAM
Disk: HP P800, 25 spindles
Virtual Machine Setup: 16 Virtual machines, each running Windows Server 2008 Enterprise Edition (64 bit), 1 CPU, 796 MB RAM
Testing Software: We used IO Meter (https://www.iometer.org) to generate the workload for the I/O system, with a maximum number of 8 outstanding I/Os per virtual machine to a 100MB file.