Monitoring .Net Web Applications Using Global Service Monitor and Application Performance Monitors
A Few Details About Our Service and Environment
I’m a member of the Monitoring and Management (M&M) team inside the Cloud and Datacenter Management Product Group. Our team runs a System Center-based monitoring and issue escalation service that is depended on by several hundred engineers across more than eight different business groups and three divisions supporting some of Microsoft’s largest externally facing web properties such as Microsoft.com, Windows Update, and MSDN/TechNet. They rely on our expertise in running and supporting Operations Manager for their infrastructure, application performance and alerting as well as Service Manager for their issue escalation and service request tracking. We provide them with the platform and the guidance in monitoring while they focus on their own application lifecycles.
Traditionally, our Operations Manager service has relied on a large shared management group monitoring more than 7,000 agents and many Azure services. The migration to System Center Operations Manager 2012 last spring improved the performance of our management group and we have handled an increase in agent load from 4000 agents to 7000 agents in a little over a year without increasing the number of virtual machine management servers and gateways and leveraging the same large physical servers for our Operations database and data warehouse.
As the engineering team responsible for the availability and performance of this instance, we have restricted console access to Operations Manager to only our team and have processes in place to ensure new management packs (MP) or updates to MPs are vetted before importing into production. While these steps have maintained a near 100% availability of our management group since moving to SC 2012, it has greatly limited our ability to expose some of the great new features in SC 2012 for application owners and engineers to monitor and quickly identify issues with their own apps.
Two of the new features introduced in SC 2012 but enhanced with SP1 are the Global Service Monitor (GSM) service used for monitoring web applications from outside your corporate network and Application Performance Monitoring (APM) which performs real time profiling of your .NET applications to capture detailed exception and performance requests. Both of these features are in demand by our own customers.
Optimizing our service for GSM and APM
As we migrated to SC 2012, it was apparent that the design of our service and infrastructure required a change in order to support GSM and APM for our customers. Some of the constraints which led us to this decision were:
Constraint |
M&M Factors |
APM supports max 400 agents/ 700 applications |
~7000 agents monitored by our single management group Some of our customers support 3000 web applications in a single IIS instance. |
GSM supports one subscription per management group |
Volume of web tests greatly exceeded a single GSM subscription |
APM and GSM configuration require Console access |
Multi-tenant properties of our management group including strict access controls and processes prohibit expanding Console access. |
Due to the above constraints and factors and in order to offer these features to our customers, we decided to change the architecture of our service to provision dedicated management groups for each business group. I’ll share the details of the changes to our architecture and how we are optimizing management and administration of multiple management groups in a future blog post. For this post, I’ll just concentrate on GSM and APM.
Web Monitoring using GSM
Web monitoring is used by our customer application owners to measure the availability and basic performance of their application and to pinpoint specific failures leading to quick mitigation or resolution.
Application owners typically construct three different types of web monitor tests each with specific purposes for both alerting and availability reporting.
Test Type |
Perspective |
Alerting |
Availability Reporting |
Base URL |
Outside network –> In |
A failure of this test indicates a problem with one or more networks, sites, or servers |
Provides availability % seen by users of that region |
Virtual IP (VIP) |
Outside network –> In |
A failure of this test indicates a problem with one or more servers belonging to this site |
Provides availability % specific to this site. |
Dedicated IP (DIP) |
Inside network –> In |
A failure of this test indicates a problem with a specific server |
Provides availability % specific to this server. |
Our M&M service has historically provided our customers with web monitoring solutions through both 3rd party services as well our own home grown custom web app monitoring at significant cost to our customers. The cost to host and support our own home grown web monitoring solution exceeds $21,000/month excluding break/fix development. Additionally for customers taking advantage of 3rd party web monitoring solutions costs per URL test can reach $600/month depending on the service and options.
When reviewing the details of GSM for consideration of our service the following were seen by our team and customers as key benefits:
Benefit |
Details |
Cost reduction |
Implementing and transitioning tests to GSM for our home grown web monitoring solution and/or 3rd party services will reduce the cost of our service to our customers. |
Microsoft supported platform |
Transitioning from our homegrown solution to GSM moves our web monitoring solution to a Microsoft PG supported feature and lessens the need for custom development. |
Simple Internal / External monitor test creation |
The monitor template in Operations Manager allows application owners to easily create monitors testing one or more URLs and specify one or more internal (management server, agent) or external (GSM) watcher nodes. |
Use a single console |
Implementing GSM allows our customers to monitor their web applications and include their health states in distributed application models along with the physical or virtual servers and database servers that comprise the application and are also monitored by the same Operations Manager instance. |
Creating a Web Availability Monitor Test is documented well in the following TechNet article so I won’t rehash that content.
https://technet.microsoft.com/en-us/library/hh881883
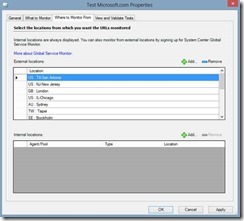
The process for creating a Web Availability Monitor that leverages GSM watcher nodes is almost identical with one exception. The wizard step that previously only allowed selecting internal nodes after installing the GSM MP now displays two sections, one for External nodes, and one for Internal Nodes.
Once the test is created and monitored by GSM the application owner can view the status of the test and availability of the application using dashboards and reports.
Detailed Dashboard
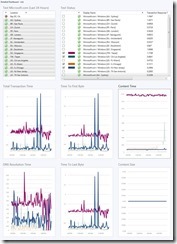
One of the two built in dashboards for visualizing the results of Web Availability Monitors is the Detailed Dashboard. This dashboard consists of several sections. The Location Health section displays the health of the monitor by test location. This section allows users to choose one or more locations to view data from. Once you’ve selected the locations you can then select the specific tests you wish to view data about in the Test Status section. The graphs below these two sections display performance data captured from each unique test location over a 24 hour period. Using the below data our customer engineers are able to quickly identify potential performance issues and any content differences based on the location of the end user and take action to resolve these issues. For instance the two spikes in Total Transaction Time, Time To First Byte, and Time to Last Byte below from the New Jersey based watcher node may be something the engineering team would investigate to understand whether there were network factors involved in that part of the world, or whether there was an issue with the web servers servicing that area during the times below.
Summary Dashboard
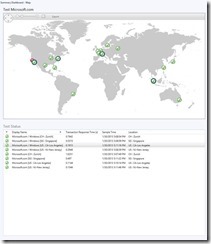
The Summary Dashboard provides users a view of the health of their application from all the watcher nodes monitoring their app. Users can select one or more of the watcher node locations on the map to display a more detailed health status including the transaction response time of the most recent test from a location. Using the view below, an application owner can quickly understand the overall health of their application from multiple locations and understand whether there may be any localized or widespread failures.
Using APM to monitor Microsoft.com
In addition to Web Availability monitoring one of the most sought after Operations Manager features in our service is APM. APM provides application owners with a mechanism to profile their applications in real time for performance and exception events which can trigger alerts but can also be viewed through two new web portals, the App Diagnostics portal and the App Advisor portal.
The following blog describes the process of configuring APM.
Setting up an APM monitor is as easy as it describes, however keep the following in mind:
· If your application exists on multiple web servers and you only want to enable the APM monitor against a subset, you will need to target the monitor to a group
· The first time you configure an APM monitor for a particular web server you will need to restart IIS after the configuration is loaded on the agent in order for APM to activate
· For any subsequent web applications configured for that same server you will need to cycle the IIS App Pool before APM data is collected
· If your web application contains an empty root folder you will need to setup overrides to enable detection of the application
APM functionality is in such demand that some of our customers such as Microsoft.com have started to leverage APM from a non-production Operations Manager instance provided by our team. One of the main reasons they have implemented APM and find value in it even before having a production ready Operations Manager instance is that it provides a non-intrusive mechanism for debugging application issues. In the past, debugging an application issue required taking a web server out of rotation, hooking up a debugger, and then attempting to repro the issue debugging once the issue is reproduced. Now with APM what used to take hours and sometimes days to capture can be done quickly and easily and without taking a webserver out of rotation.
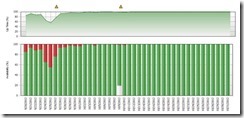
One example that illustrates this value was a new version of a web application deployed by Microsoft.com. Shortly after the deployment the availability of the site started to drop as measured by GSM.
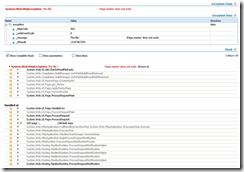
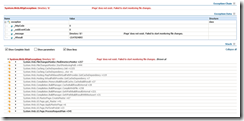
The engineering team initially attempted to debug the issue without access to APM data. After spending several days investigating the Microsoft.com engineering team configured APM monitoring for this application. Now with APM data they were able to view all exceptions captured using the App Diagnostics portal and identify the failure corresponding to the GSM reported outages. The screenshot from the App Diagnostics portal indicates the failure is a 404 event which would typically be simple problem to diagnose and resolve. However, this issue was not simple as it involved how the rendering framework was caching the master page and calculating the path when it did not find it in cache which was not identified until the use of APM data. With the data provided by APM, call stack, path, etc.., the engineers were able to provide the development team with enough information to construct a repro of the issue and develop a fix.
 |
|
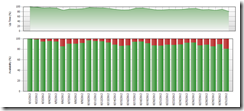
Once the engineering team deployed the updated code it was easy for the team to measure the improvement by using GSM availability reports. You can see from the screen shot below that there is a noticeable improvement as the fix was deployed across the web servers.
Based on the experience from our customers like Microsoft.com we see tremendous benefits and capabilities by adding APM to our standard monitoring tools. Some of these key benefits include:
· The ability to quickly configure monitors using the Operations Manager IIS application inventory
· The ability to profile applications for exceptions or performance events without modifying code
· Near zero touch non-intrusive debugging
· Statistical views and easy analysis of top failures and worst performers.
Next Steps
As we look towards our future production implementations of dedicated Operations Manager instances, we are very excited about the core use of GSM and APM by our customers. By providing our customers with direct console access, they will be able to leverage these features and many more. Additional areas we will look to add for our customers include Visual Studio Web Tests and Visual Studio Dev Ops lifecycle integration to help closely tie the engineering teams and development teams.
