Case Study: Using Diagnostics-Performance Events as a Desktop Health Indicator
Note: The solution below only pretains to new installations of Windows Vista+ since specific Diagnostics-Performance events are only repeated a small number of times before stopping. In addition, solutions to these events vary and depend on the source of the event. In the case below, drivers needed to be updated.
Starting with Windows Vista, Microsoft started reporting on potential performance issues with the client operating system (Vista and Windows 7) by alerting on drivers, services, or applications that experience resource contention or take too long to respond during the "sleep", "resume", and "reboot" operations.
Recently while piloting Windows 7, a large enterprise customer collected all "Diagnostics-Performance" events from their Windows 7 clients using the built-in Windows Event Forwarding feature in order to gain a perspective on the general health of their client population. What they found was interesting. Essentially there were a set of out of date drivers that was impacting the performance and overall experience of a large percentage of the Windows 7 client population. In this case the solution was simple; upgrade the out of date driver.
Here are the details:
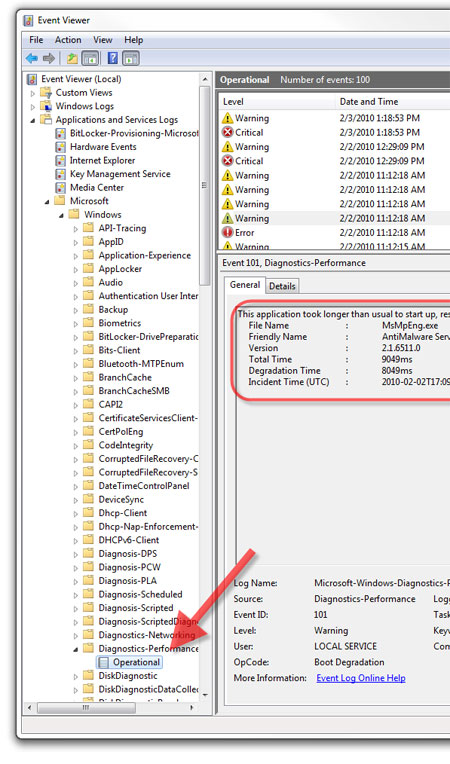
The Diagnostics-Performance channel is located in the following path within the Event Viewer: \Applications and Services Logs\Microsoft\Windows\Diagnostics-Performance\Operational
In this case the Windows Event Forwarding design leveraged System Center Operations Manager (SCOM) to view and report on the collected events. The SCOM 2007 agent can forward collected events from the Event Collector into its database as follows:
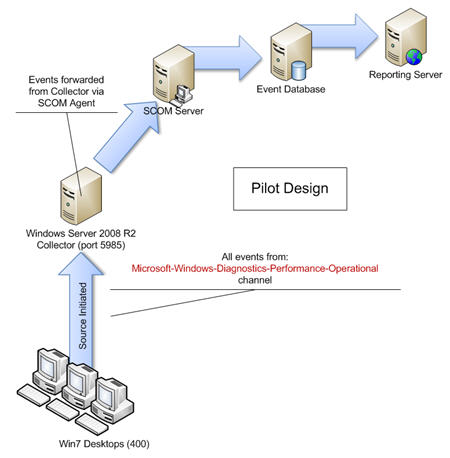
Note: Starting with Windows Server 2008 R2/Windows 7, the WS-Management transport for Windows Event Forwarding now uses port 5985 as the default port (rather than port 80). Security by obscurity? Since the Vista WS-Man client default port was 80 and since there is no Group Policy object for changing the default client WS-Man port, this customer creatively hard set the port within the Event Collector Server URI by using the following format: "<server name>:5985".
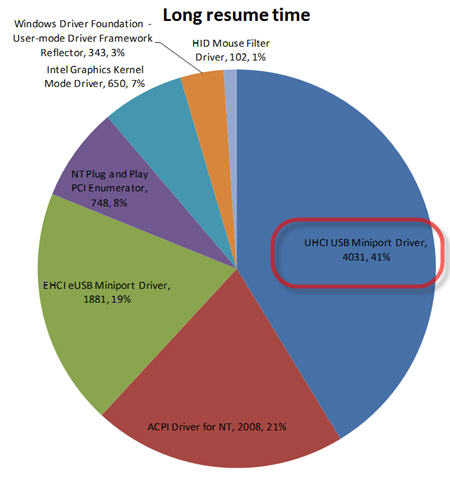
The following is a summary of all client events from the Diagnostics-Performance channel. Notice the USB Miniport driver accounted for over 40% of all performance degradation issues across their client base. Fortunately there was an update for this driver that solved the problem.
The following is a specific example of the problematic event (Source: Diagnostics-Performance, Event ID: 351):

|
Diagnostic-Performance Event |
|
|
Log Name |
Microsoft-Windows-Diagnostics-Performance/Operational |
|
Source |
Microsoft-Windows-Diagnostics-Performance |
|
Event ID |
351 |
|
Task Category |
Standby Performance Monitoring |
|
Level |
Warning |
|
Keywords |
Event Log |
|
Description |
This driver responded slower than expected to the resume request while servicing this device: Driver File Name: \Driver\usbuhci Driver Friendly Name: UHCI USB Miniport Driver Driver Version: 6.1.7265.0 (win7_rtm.090624-1905) Driver Total Time: 164ms Driver Degradation Time: 59ms Incident Time (UTC): ?2009?-?07?-?10T18:30:51.916061000Z Device Name: PCI\VEN_8086&DEV_2937&SUBSYS_20F017AA&REV_03\3&21436425&0&D0 Device Friendly Name: Intel(R) ICH9 Family USB Universal Host Controller - 2937 Device Total Time: 288ms Device Degradation Time: 0ms |
Although the "Diagnostics-Performance" channel can give another perspective of the overall health and user experience on the Windows 7 client, the standard "System" and "Application" logs should still be foundational for determining client health. Unfortunately, due to the high number of events in these logs, an upfront investment is required in order to gather actionable events from a set of clients.