Exchange 2013 Monitoring Mailbox Databases and Queues
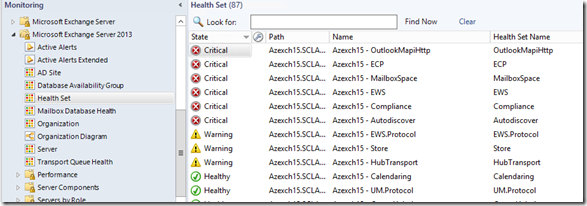
With Exchange 2013 Exchange Product Group has chosen a different route and implemented all the monitoring inside Exchange server which is called Exchange Managed Availability. When it comes to monitoring from Operations Manager all we have is a discovery scripts, some perf collection rules and one ( yes only one ) event monitor which tracks the events created by Exchange Managed Availability Service. I will not be getting into the Managed Availability and its components. As a summary it has different components called health sets and Exchange server performs ~650+ individual checks on these various components.
You can find more details about Managed availability on following posts;
Lessons from the Datacenter: Managed Availability
Customizing Managed Availability
One of the problems of this component/service based approach is now we don’t have the visibility to individual objects like Mailbox Databases or Transport Queues. These are hidden under specific health sets.
One of my colleagues Russ Slaten has written an extension management pack to solve the very same issue for Exchange 2010 his posts can be accessed here;
Monitoring Exchange 2010 Database Backup and Mount Status
After using his management pack in many customers I wanted to do the same for Exchange 2013. I have used his techniques but I had to modify them to work with my own requirements. I have also added some extra monitors rules and added Queue monitoring. So this is what this MP is all about . Lets get into the details ;
Discoveries
This MP will discovery individual Mailbox databases (stand alone or DAG) and Transport Queues on Exchange servers. Discovery is a PowerShell script runs against Exchange server object every 12 hours.
After importing the MP discovered mailbox databases can be accessed under Mailbox Database Health view under default Exchange MP folder.
And discovered Queues can be accessed under Transport Queue Health view .
Monitors
There are 3 monitors targeting to Mailbox database
- Check Database Mount Status – From Russ’s MP sample , checks if DB is mounted or not
- Mailbox Database LastAnyBackup Check : This is a modified version of 2010 MP. In my script I check both incremental and full backup and if any backup exist in configured period monitor is healthy.
- Active Preference Check : This monitor will check if database is mounted on Active Preference 1 if database failovers to any other node monitor will become warning.
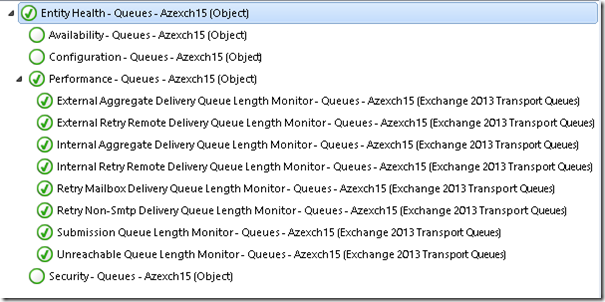
For Queues I have the following monitors configured ;
Let me remind you that all these are also monitored under Hubtransport Helath Set for the Exchange Server. So based on your requirement you might use this one or the one provided on Exchange MP.
Additional Views
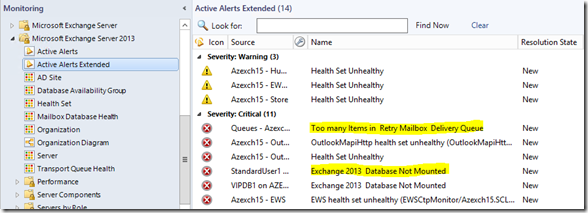
I have also created a group to include new custom objects as well as the existing one. This group is referenced in Active Alerts Extended view. You can use this view to see all alerts generated by Exchange components.
Performance Collection Rules
There are 7 performance collection rules targeting to Mailbox Databases which collects ;
- Database size
- Database Whitespace
- Number of Mailboxes in Database
- Local Mail Flow latency ( Test-Mailflow )
- Login Latency (Uses Test-MAPIConnectivity)
- Last full backup age
- Last incremental backup age
From rules targeting to Mailbox Database you can disable the ones not needed in your organization.
There are 10 performance collection rules targeting to Queues .
These rules can be modified by selecting Exchange 2013 Transport Queues as target(class).
Cookdown
Cookdown in Operations Manager is the process of utilizing single data source to monitor multiple objects on server. On very basics if you want to monitor 10 individual database on a server you need to run your script 10 times which is very inefficient and resource consuming. So with cookdown we modify the script in a way that it outputs multiple property bags for each database we want to monitor and condition detection modules in monitors/rules take care of the rest.
So I tried to utilize this as much as possible. I share the data source in multiple rules so I have cookdown for all instances and for all rules. For database performance collections all of these rules actually retrieves data from 2 scripts. So if you have 10 mailbox database in an Exchange server instead of 10x5 = 50 scripts , I run just one which then picked up by individual rules and written to database.
The reason I have 2 script is Test mail flow script has a timeout parameter and takes longer then the rest of perf collection so this is the only reason I’ve separated it.
To get the benefit from cookdown all these rules are configured run same time by Synctime setting in MP they will run every 15 min with Synctime setting 00:00.
Additional Configuration(Optional)
When I was developing the management pack my customer wanted the flexibility to classify health sets. In default configuration we have a two state monitor Healthy and Error . But for most customers all these health sets are not equally important. So My customer wanted to reflect Customer touch point as critical but all others as warning. We also had a second requirement where we need to use health sets in dashboards which doesn't work by default. For details please check my other post How to fix the Health Rollup Problem in Distributed Applications with Exchange 2013 Health Sets.
To overcome all these I’ve duplicated the existing event monitor and created 2 replicas. One has unhealthy state defined as warning , other as critical. These 2 monitors are targeted to Availability for the health sets and disabled by default. There are also 2 groups defined in MP ;
- Critical Health set Objects ,
- Warning Health set Objects
These 2 monitors have overrides defined to enable then using these groups. . All you need to do is disable the existing monitor , add the more important health sets to Critical Health sets group and less important ones to warning health sets group .
Update – Script Based Dashboards
I’ve added two script based dashboards under Exchange 2013 Default folder.
Queues
This dashboard will show all transport servers and their queue status
Database Performance Counters
This dashboard will show all mailbox databases and associated performance counters
Update- 16/3/2015
Mailbox count for the databases was showing max 1000 mailbox because I forget to add -ResultSet Unlimited switch. I've updated both MP files to show correct mailbox count.
Important !!!
Always test the supplied MP’s in a test environment first , modify them based on your needs than move it to production.
Download link
Zip files contains the base MP Microsoft.Exchange.15.Custom.Extension.xml and same MP with 2 additional Script based dashboards shown above) under MPScriptDashboards folder.
Script Dashboard version requires new visualization MP comes with UR3.


