Getting to Grips with the App-V Client Log Parser Utility (Launch Times)
Understanding your application Launch Times is a powerful thing to understand. It keeps you in touch with what your actual end users go through when launching applications. When your client log file is set to informational logging, which it should be by default;
This will gather some great information on application launch times in the sftlog.txt file
[09/29/2008 20:37:00:643 SWAP INF] {hap=95:app=SIMS .net 1.40.20:tid=109C:usr=xxxx}
Elapsed time for launch: 16.781 seconds
This information is gather on execution of an application.
So following on from Getting to Grips with the App-V Client Log Parser Utility step 6, We will use Microsoft Office Excel 2007 to create these.
6) Open Excel
7) Click the “Orb” and than select Open, In the Open dialogue change the file type to “All Files” and now browse and locate your App-V parsed log file and then select “Open”. In this example we shall use the log file from 4.c (launch.txt).
8) A new dialogue box will Appear called the “Text Import Wizard – Step 1 of 3”, when this wizard opens select the option for “Delimited” and then click Next.
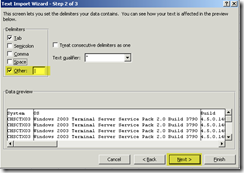
9) In the “Text Import Wizard – Step 2 of 3” check the check box for “other” and add a “|” into the box (you should see some lines now break the data in the data preview) and then click Next.
10) In the “Test Import Wizard – Step 3 or 3” click Finish.
11) Your data will now appear in the excel tables
12) Now that the data is formatted nicely this is where the fun can really start!!!! There is a feature in Excel Called Pivot tables and it makes life so much easier to review the log files, look at trends, see data over a month period!
So lets get started!
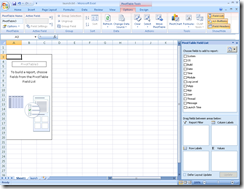
13) Select all your data, you can do this by clicking the top left corner square, Then select the Insert TAB in Excel, When in the insert TAB click the Pivot Table Button.
14) In the Create PivotTable Click OK.
15) A new sheet will open and this is where you can create some great Pivot Tables and review your data
16) Once you get to this stage you can do some great stuff! And its totally down to you how you want to play with the data!
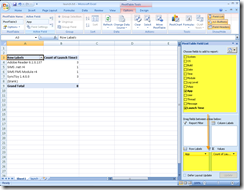
You can drag items from the PivotTable Field List to the fields underneath it;
The Above is showing the App in the Row Labels and the Count of Launch (Launch Time) in the Values.
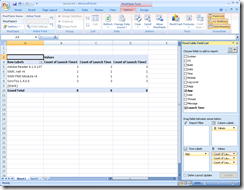
17) Drag down so that three launch times reside in the Values field. and the App in the Row Labels.
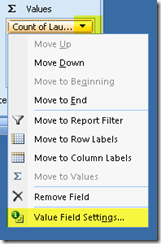
18) We now want to change the Count of Launch to slightly different values. In the first Count of Launch click the drop down and select the “Value Field Settings…”
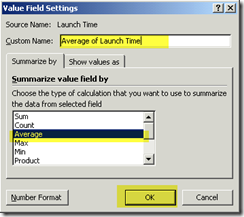
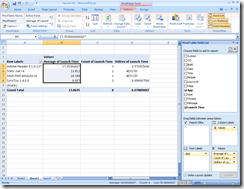
19) In the Value Field Setting, Select “Average” from the Summarize value field by section, and confirm that the custom name is “Average of Launch Time” and then click ok.
20) In the first Value column it will give you the Average Launch Time for the application
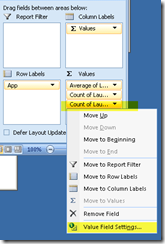
21) We now want to change the 3rd Count of Launch to slightly different values. In the third Count of Launch click the drop down and select the “Value Field Settings…”
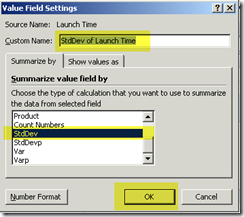
22) In the Value Field Setting, Select “StdDev” from the Summarize value field by section, and confirm that the custom name is “StdDev of Launch Time” and then click ok.
23) The results now give us a good visual display of our virtual applications. We have an average launch time of our applications which we can now compare to a locally installed applications launch time. We have a count of launch times which is important as it allows us to understand how many times this application has actually been launched, and most importantly our standard deviation, which allows us to see the skew in the data returned a larger stddev means that the data has a wide range of results returned where as a small standard deviation shows that the results are all very similar.
Where you see #DIV/0! means that the count of Launches is only 1 and therefore the actual skew can be nothing.
Remember you can double click on the values to return the details.
This is great information to gather. Especially if you have 100’s / 1000’s of applications that you would like to get some more information on.
Hope this helps a budding scripter to create some great corporate data!


