PowerPivot – next gen Business Intelligence (BI)
by Ron Grattopp…….Although PowerPivot has been available for a few months now, I recently saw the following Network World blog post (How Microsoft PowerPivot will disrupt BI) and thought it was an interesting take on the impact of PowerPivot, Microsoft’s “PivotTable on steroids” (link to a webcast referenced in the article), designed to allow end-users, on a self-service basis, to pull in massive amounts of data from various source repositories and sort and filter them almost instantly. Of course, being able to see and analyze the results of that slicing & dicing is what BI is all about.
Hopefully, if you know BI at all, you are probably aware that Microsoft has been in Gartner’s “Magic Quadrant” for Business Intelligence (BI) for some time now, (Gartner’s latest BI Platform Magic Quadrant), so this is not new territory for us, but what is new is the push toward what some are calling the “democratization” of BI, in other words, bringing this important, strategic capability to the multitudes of information workers out there, especially those in SMB, vs just the relative few BI experts.
BI has historically been a customized, expensive, and thus niche, application and was generally limited to enterprise deployments where they had, and could afford the IT assets necessary to accommodate it. The idea of using Excel as a BI front-end vs using a custom platform & UI has facilitated the transition of BI into a mainstream solution which can actually reduce the need for management and development cycles in IT rather than increasing them. So it now becomes a more viable solution for the SMB space. And you should be helping your SMB customers understand and realize the strategic importance of BI to help them gain more insight into their business through more effective and efficient use of the business data that even small companies collect.
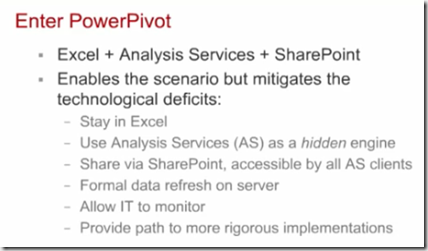
One new facilitator then for this leap into “BI for the masses” is PowerPivot, a free download. PowerPivot comes in 2 flavors: a desktop, or client add-in, version for Excel 2010 and a server-based version, PowerPivot for SharePoint 2010 (which also requires SQL Server 2008 R2 on the backend). Of course, Excel is the UI in either mode. The familiar Excel workbook is the “window” into whatever data that you want to leverage; including SQL or Access databases, OLAP cubes, a SQL Reporting Services report, ATOM RSS feeds, CSV files, other Excel data such pivot tables, or any OLEDB/ODBC source. PowerPivot for SharePoint is essentially SQL Server 2008 R2 Analysis Services hosted in SharePoint, but this has 3 very important aspects, in that once your PowerPivot data is published it can be accessed by others via a browser (leveraging Excel services), and two, SharePoint offers IT administrators the ability to monitor and control “self-service” BI thru their dashboards which can reduce their workload and burden, and finally the SharePoint hosted workbook becomes a real-time “single version of the truth” which is a huge benefit. So there’s part of your sales pitch.
Here’s a screenshot from the webcast linked above that’s a good summary of some of the main ponts of PowerPivot.
Hopefully, I’ve got you interested in finding out more about PowerPivot already, but if not, here’s a quote from the article that makes some key points that I think you’ll appreciate:
“Data can be reorganized around one column or compared against columns from another data source. You can divide the data by time, geographic origin or some other parameter. … And PowerPivot can work blazingly fast too. Architecturally speaking, it replicates the technology found in many in-memory databases, allowing users to sort millions of rows of data within a few seconds.“
Another term you’ll see around PowerPivot is DAX, which stands for (Data Analysis Expression), which is basically a new (or rather extended) formula language for PowerPivot – it performs some of the data analysis that you would typically have done via a SQL statement, but it does it in way more familiar to Excel users (who aren’t also SQL programmers).
Of course in Excel you can then leverage tools such as Slicers to gain insights into the data that would have been otherwise been obscure or hidden. And all the charting and reporting tools that you’ve worked with in Excel can be leveraged to insure your new insights are presented and shared to maximum effect.
So, here’s the link to Microsoft’s public BI portal.
And here’s the link to the PowerPivot portal and download.
Here’s another article from InformationWeek that you might read as well. Global CIO: Microsoft Pushes BI For The Masses
And, finally, another link to a short InfoWorld article that you might like. PowerPivot for Excel 2010: Power to Excel people
Bottom line, Microsoft is bringing this important capability into the realm of your SMB customers. You, my partner, should be very interested in finding out how BI can be the lever to open up new and important business insight possibilities for your customers, and for you to become that Trusted Advisor. Also, in case you’re still wondering what appeal what a free app would have for you as a partner looking to sell infrastructure and services, consider that we are talking upgrades to Office 2010 (which will likely bring along Windows 7 upgrades as well), not to mention the SharePoint and SQL cross-sell that this will likely incur. What are you waiting for.
Cheers,
Ron


