Data always tells a story
Data always tells a story. The easiest stories for it to tell are about what happened in the past while the hardest, but more interesting, are about what might happen in the future. Today, data and its stories have become one of the most valuable resources to strategic and operational decision makers. Consequently, the technologies providing those data insights are now a critical part of an organisation’s technology portfolio.
In the area of data related technologies, there are often several terms describing the same capability and several capabilities described by the same term. The difference between business intelligence and advanced analytics is such an example and often attracts conflicting interpretations from users, vendors, and industry commentators. The aim of this article is to explore those differences and why business intelligence and advanced analytics are increasingly different.
Business intelligence – is here to stay
The term business intelligence was first used by Richard Devens in his compilation of business anecdotes in 1865, although its first technology related usage was by Hans Luhn of IBM in 1958. Yet, even with the backing of then industry leader IBM, it wasn’t until Gartner analyst Howard Dresner used the phrase in 1989 that it started to become part of everyday business terminology! That said, regardless of who is considered to have invented the term, it’s clearly not new. That may explain why its meaning has become synonymous over the last few decades with the graphs, charts, and tables of figures showing what was sold, what was made, or what was done.
Business intelligence technologies today are almost unanimously considered to be those which use data to tell a story about what happened in the past. They retrieve data from a source system, sort and format it, perhaps perform some calculations on it, and then display it either graphically or numerically. Although this capability has been available to business users for several decades, over the past few years there has been a dramatic increase in what can be done by business intelligence platforms.
As examples of their recent and continuous innovation, the list below describes some of the capabilities in today’s business intelligence technologies. Alongside each capability is a link to examples of related Microsoft product documentation, typically for its Power BI platform.
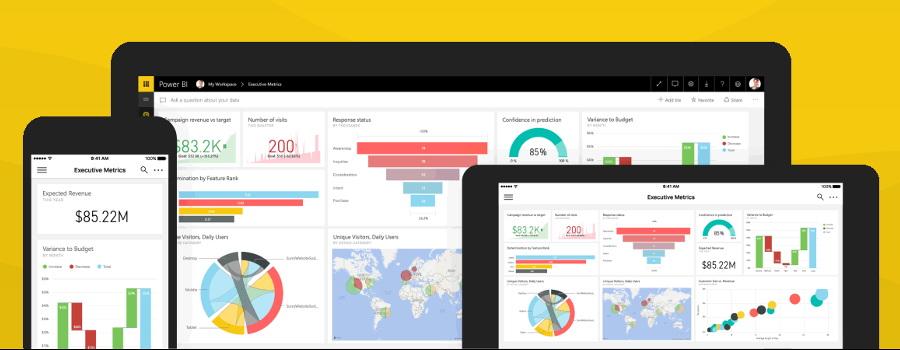
- Interactive and custom visualisations – Gone are the days when graphs of data and tables of values on a report were static and fixed. Now, the business users of reports, dashboards and visualisations can decide for themselves how they want to filter, group and aggregate the historic data served up on an interactive report. Businesses can also create their own custom visualisations to embed their business model logic directly into their reporting tools or show non-transactional data. For example, they may use Gantt charts to show project performance data or word clouds to visualise customer feedback.
- Mobile dashboards – Having access to dashboard and visualisations anywhere and on any device has helped make data an even more useful operational asset. Now factory floor workers using tablets can see operational metrics while managers review strategic reports on their phones while they travel. No longer is analysis restricted to the desktop PCs in a traditional office environment.
- Big data and application API integration – The data businesses want to analyse today can come from many sources, not just a traditional data warehouse. To support these varied and often proprietary data sources, modern business intelligence tools such as Microsoft Power BI can query data from application APIs such as Microsoft Project Online and from services such as Microsoft HDInsight or Azure Data Lake.
- Natural language queries – A common concern with business intelligence tools has been the level of technical knowledge needed to create the most valuable queries. The query writing process has always introduced hurdles for business users regardless of whether custom queries can be created using a graphical interface or written in code. Today, the most advanced business intelligence platforms, such as Microsoft’s Power BI, competently support natural language queries, sometimes known as Q&A. These allow end users to ask questions in natural languages, such as English, rather than write a bespoke query. For example, users can ask “What were total sales last year?” and if the service has the data, then it provides the answer.
Today’s marketplace for business intelligence tools is crowded. It is packed with desktop and server based technologies, generic and industry specific packages, and those which range from free to very expensive.
The simplest to use and probably the most common for a long time yet is Microsoft Excel. It allows data to extracted from source systems, pasted from clipboard, or calculated from other spreadsheets. It then lets business users create graphs, write bespoke calculations to find trends, and then save and email their spreadsheets as though they were any other kind of document.
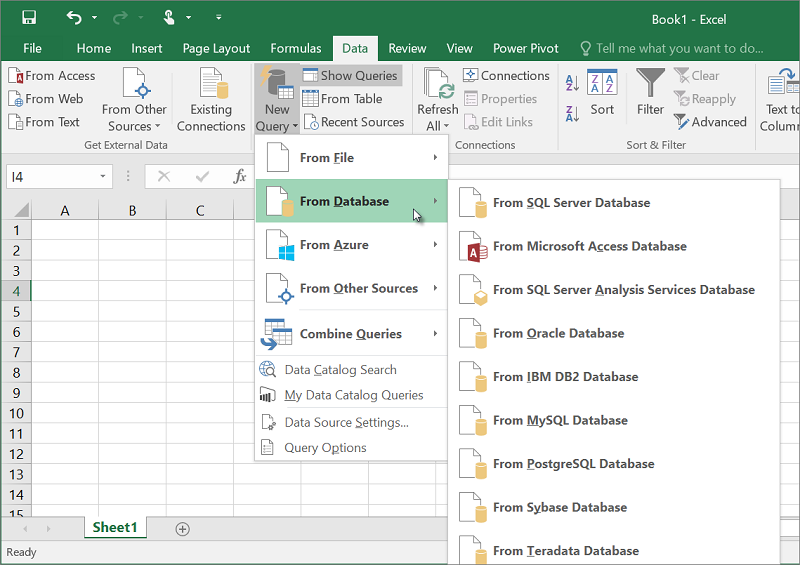
Microsoft Excel 2016 and its list of supported data sources
Another familiar sight in recent years for Microsoft centric organisations has been SQL Server Reporting Services. This web-based and server-hosted service provides paginated reports with tables, graphs, and some degree of end user interaction. While it may have lacked the elegant look and deep functionality of its peers, such as Business Objects and Tableau, it was included with the SQL Server licences most organisations were already buying so became the standard in Microsoft technology based organisations.
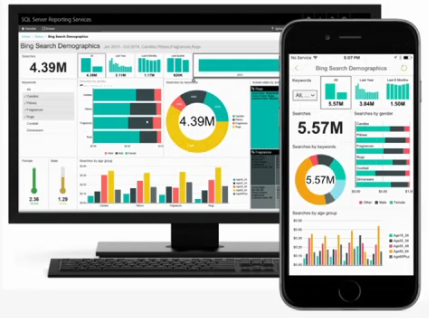
The modern look and feel of SQL Server Reporting Services
Both of these Microsoft products provide business intelligence, they use data to tell a story about what happened in the past. However, Microsoft has adopted a broader meaning of the term with the creation of its Power BI platform. Not only does Power BI provide business intelligence capabilities like its name suggests, but its support for the analytics language R means it now also provides its own advanced analytics capabilities.
Advanced analytics – looking to the future
Both vendors and analysts agree that advanced analytics use statistical algorithms to generate new insights in ways not available from traditional business intelligence tools. For example, Gartner describes the term as meaning “the autonomous or semi-autonomous examination of data…..to make predictions or generate recommendations”. Similarly, Microsoft’s more technology focused product documentation regularly uses the term to describe its machine learning and data science tools.
Not only does advanced analytics differ from business intelligence in what it does, but it usually also has a different audience. Whereas good business intelligence tools are business user friendly, many advanced analytics technologies require an experienced developer with knowledge of handling data. This is demonstrated by the fact that advanced analytics requires a source of good data and usually lots of it. At this point it is feasible to ask how advanced analytics compares with data science given a data scientist’s knowledge of big data and data engineering. Some will even argue that true advanced analytics can only be done by a data scientist.
That said, not all of advanced analytics is about finding new patterns in large amounts of unexplored data. It can also be about creating forecasts using small but already well understood sets of data. For example, Microsoft Dynamics CRM uses built-in advanced analytics models to calculate the likely success of a sales opportunity. Other business applications have had similar basic but automated forecasting capabilities in them for several years, such as supply chain management systems.
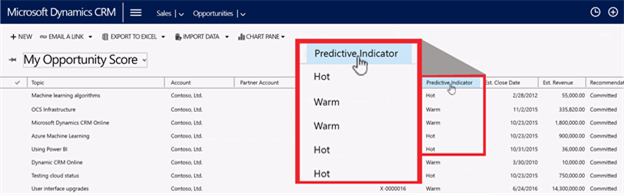
Automated sales opportunity success prediction in Microsoft Dynamics CRM
Although some business applications have these built-in capabilities, critics of advanced analytics often question its ease of adoption if a business wants to get the most value from it. That value usually comes from using statistical algorithms to find useful new patterns in data faster than it would take a human. Finding those patterns usually requires searching through vast amounts of data, often so large it needs to be stored and managed by big data format database systems.
To deploy these pattern finding processes, a developer may use a language such as R or Python and query data stored by an HDFS file system. The fact that this sounds very similar to how a data scientist uses machine learning shows one of the challenges of using the term advanced analytics. Currently, advanced analytics describes the whole family of “post-business intelligence” technologies, rather than those not described by any other term.
Advanced analytics then can be considered the collective name for the following two technology areas:
- Big data – While this on its own is a big area of technology, the patterns which advanced analytics algorithms look for are often within large volumes of data stored by big data platforms, such as Microsoft HDInsight service or the Azure Data Lake Store service.
- Machine learning – Again, another large area of technology which is implemented by languages such as R and Python to find new patterns in data. Once patterns have been found, the models which describe them then go on to predict unknown values where a required set of values are already known.
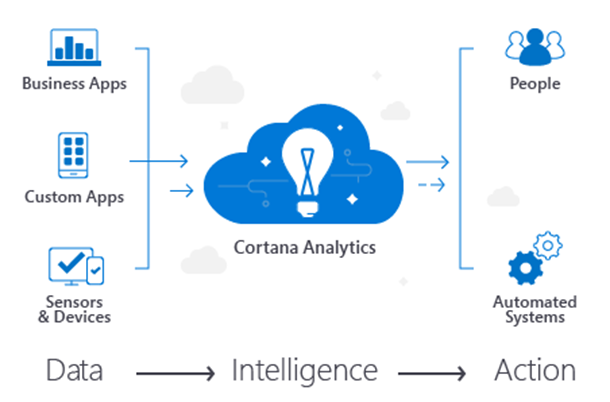
An overview of Microsoft’s Cortana Analytics solution, an example of a different name being used to describe a familiar set of capabilities
The difference between business intelligence and advanced analytics
The aim of this article was to identify and explain the differences between these two commonly used data focussed capabilities. Consensus today reinforces the suggestion that business intelligence technologies report historic data while advanced analytics technologies help predict future values or outcomes which are currently unknown. Yet while there is clearly a different definition for each term, the products and services vendors provide today blur them. Business intelligence tools increasingly provide advanced analytics capabilities, while the already broad term of advanced analytics describes two existing sets of already loosely defined capabilities: big data and machine learning.
However, despite the evidence showing that business intelligence tools are the more established of the two, their innovation shows no sign of slowing. Microsoft’s Power BI platform is evolving both its business intelligence and advanced analytics capabilities. Likewise, Microsoft is working hard to make complex use advanced analytics technologies easier to use, typically be delivering them to developers as ready-to-go Platform as a Service or Software as a Service APIs.
Further reading
The links below are for those wanting to read further about how current application and data solutions can use advanced analytics technologies – and an academic opinion on how:
- Advanced Analytics Courses - Microsoft Virtual Academy
- Microsoft - Cloud+AI: Transforming the future : Learn Analytics - Microsoft
- "Making Advanced Analytics Work for You" – Harvard Business Review
Gavin Payne is a technology focused consultant and solution architect who helps businesses grow faster by evolving their analytics, data and cloud capabilities. He is a Microsoft Certified Architect and Microsoft Certified Master, and a regular speaker at community and industry events.