From data to insight and impact – the BI revolution

This article is for those new to the world of business intelligence, such as application developers and cloud architects, who want to understand how a typical BI solution works, what each of its components do and some of the technologies used to implement them.
While it sometimes mentions Microsoft technologies, the principles it explains are vendor agnostic so it shouldn't matter if readers work in environments that use different technologies, on-premises or cloud services, and with structured or unstructured data.
The value of data to businesses has never been greater. Competitive advantage no longer just comes from product design, price or advertising but also from knowing what customers want, how much they’re willing to pay and when they’ll want to buy. This is why book stores now ask you to sign up for a loyalty card – so they can collect and analyse the data about what you buy that you’re automatically giving their online competitors. It’s why business leaders are asking their finance, sales and marketing directors – as well as their IT teams – how they can find value in the mountains of data they’re sat on. And for application developers, cloud architects and IT operations teams, it’s why data related innovation seems to be happening all around them. However, despite being in the middle of an era of digital innovation, a business intelligence (BI) team’s goal has always the same: to use knowledge about what happened in the past to help make better decisions in the future. 
To give the world of BI some structure, the diagram above shows the typical process for turning source data into business insights.
First things first - finding source data
Before any trends can be found, comparisons made or anomalies detected, source data needs to be found and made ready for analysis. It sometimes also needs to be converted into a format ready for analytics queries, known as denormalising, and cleansed to correct data quality issues.
Traditionally, most of a business’s data has been the structured data its transactional application systems generate – and much of it still is. Each working day, applications create hundreds, if not thousands, of records which get stored in rows and columns and describe what a business has made, sold or done. However, businesses are finding new sources of intelligence – often stored as big data. This differs from structured data because each item in a data set might have a different structure (imagine analysing a folder of 200 similar but not identical spreadsheets) or one item on its own is meaningless but a million of them are priceless (such as a web site’s traffic logs). Therefore, modern BI tools and technologies are being designed to hand both structured data and big data despite their significant differences.
The process of turning data into business insights
Although the industry often has different definitions for BI and analytics, it can also use them to mean the same thing. For this introduction, we’re going to assume they have the same meaning but if you read more on BI then you’ll probably find that (in a nutshell) BI often describes older and less interactive reporting capabilities while analytics describes more recent interactive data discovery tools sometimes designed for end users.
Data warehouses
The data used by reports and analytics queries is usually stored in a data warehouse, a special type of database optimised for storing large amounts of historical data that then gets analysed. Data warehouses can often be very large (several terabytes isn’t uncommon) but they can also be small and just as valuable. What makes them different is their database schema. It’s designed to make them efficient at finding, aggregating and comparing large volumes of data whereas transactional databases are typically optimised for retrieving and updating much smaller numbers of rows. To design their schema, data warehouse developers often use the Kimball methodology to create a star schema database. This concept has one or more fact tables which store the details of individual business transactions that are then described using attribute values stored in dimension tables. The purpose of this is to reduce the number of duplicate values stored in the fact table but also to optimise the performance of large analytics queries. Data warehouse databases are often stored using the SQL Server database engine and in recent years query performance has benefited significantly from its Columnstore index feature.
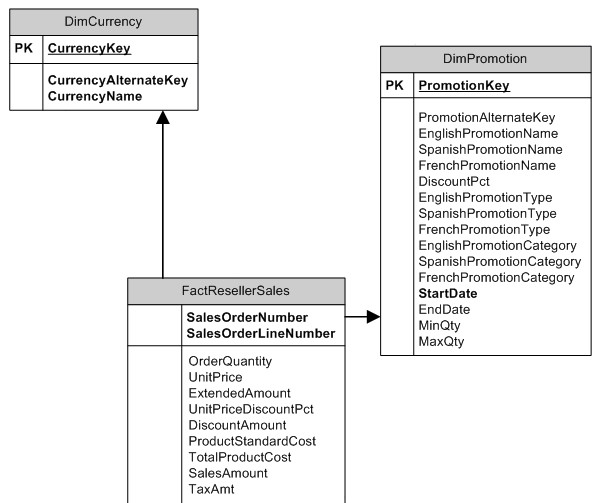
The diagram below shows a small part of a data warehouse database’s design that uses a star schema.
ETL processes

To load data from a source application’s database into a data warehouse, ETL processes are used. ETL stands for Extract, Transform and Load, and describes the three steps that are often needed to load data into a data warehouse. The Extract step usually connects to a source application’s database and is programmed how to identify all the records that have been created or updated since the last time it ran. For some applications, this is easy, for others its near impossible! With each piece of data that gets extracted, it often needs to be Transformed to convert it from being in a normalised transactional format into a denormalised and star-schema format. Once this is done, the data then gets Loaded into the data warehouse's tables. To create ETL processes, developers typically use SQL Server Integration Services or the Azure Data Factory service. ETL processes are typically scheduled to run once a day, or perhaps once an hour, because they can be very resource intensive processes which means data warehouses are rarely a realtime data source.
Data discovery
Once data is being loaded regularly into a data warehouse, it’s ready for BI developers and end users to start analysing it. To do this, they commonly use visual data discovery tools. These allow them to see the schema of the data warehouse, perhaps integrate external data feeds such as Google Analytics statistics, define relationships between data entities and then save their custom data models. Once saved, these data models are then used as the data source for further analysis, reports or visualisations. By “wrapping” a data warehouse with a data model, its sometimes hard to understand database schema can be presented as an easier to understand logical model. A common tool used to this data discovery is Microsoft Power BI which has both visual data modelling and data transformation functionally. Its transformation capabilities are particularly powerful because it uses the DAX formula based language that can that can be used to perform custom calculations within the data model. An overview of the Power BI data discovery functionality is available here.
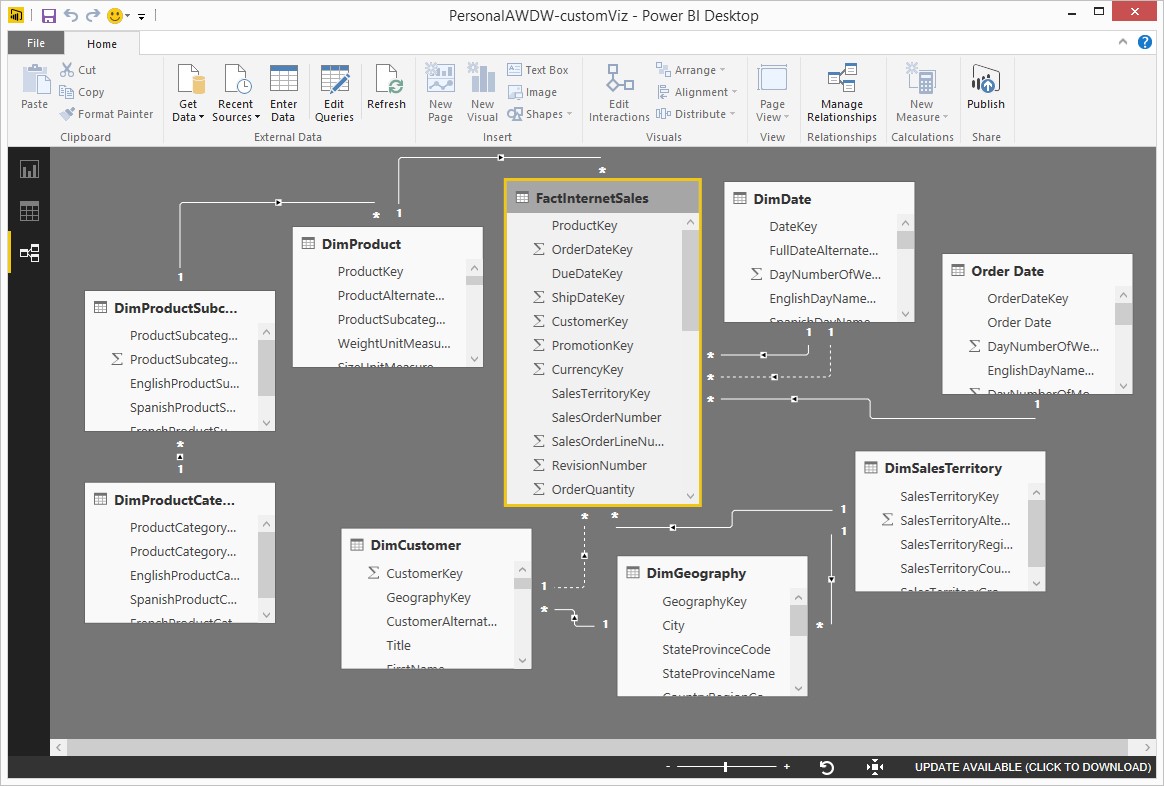
Below is an example of a data model defined visually within Power BI.
Data visualisation
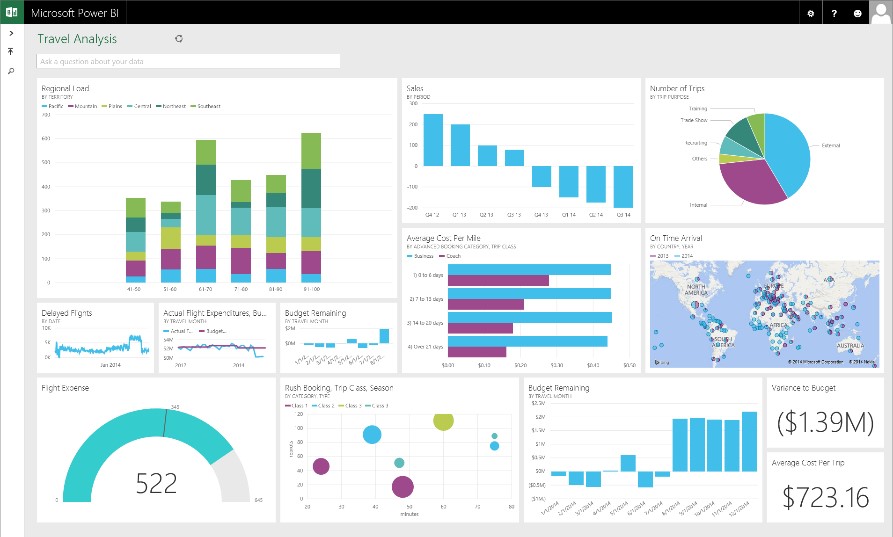
Finally, once data has been loaded from a source system into a data warehouse and relationships found with a data model, it's ready to be visualised. Traditionally, this meant creating server based reports which despite their age are still valued by business leaders who want to see “pages of figures”, bar charts and line graphs from within a web portal. The SQL Server Reporting Services platform (link) is still a popular way of creating and publishing these paginated reports especially now it provides a rich mobile device experience. For audiences who want interactive analytics dashboards, then Power BI has again become a clear winner. It’s desktop and cloud based platforms allow both business power users who know their data well, and analytics developers, to create rich graphical dashboards that can be drilled down into and have their underlying data explored as much as see and observe the data's trends.
Next steps
This overview of how IT teams provide BI capabilities has hopefully shown those new to the world of BI the processes of taking data from an application and visualising it a reporting dashboard. Tools like Power BI have made this easier yet they still require data to be interpreted, relationships defined and calculations performed before trends, comparisons and anomalies can be made and found. The role of the BI specialist has never been more valued by business teams.
We’ve also seen there’s a wide range of skills needed to design, deploy and operate a complete BI solution. From database design and ETL process development to report and visualisation creation. For those interested in learning more about working with BI solutions then I suggest you follow each of the links above and then begin to get a feel for which area complements your existing knowledge the most - or which motivates you the most to learn a new skill. To help with the next stage of your learning, I then recommend browsing through the free online courses for Data Professionals on the Microsoft Virtual Academy here.
---
Gavin Payne is the Head of Digital Transformation for Coeo, a Microsoft Gold partner that provides consulting and managed services for Microsoft data management and analytics technologies. He is a Microsoft Certified Architect and Microsoft Certified Master, and a regular speaker at community and industry events.