The fast path to an Azure IoT project
By Microsoft UK Azure IoT Team,
Whether you’ve been working with the Internet of Things (IoT) for years or are just dipping your toe in the water, you’ll probably be aware of the potential benefits of gathering, monitoring and analysing data from connected devices.
You might also be aware of the complexities involved in setting up an IoT solution. The Microsoft Azure IoT Suite aims to take away the complexity of deploying multiple components of an IoT solution by letting you quickly launch a preconfigured scenario for your broad use case and customise it to your exact needs. The suite handles the various underlying Azure services, meaning you can get up and running fast with your devices and data.
In this article we’ll be taking you through how to set up a solution to monitor temperature and humidity data from a small set of sensors. It’s best to start small, so you can see the real value, and then scale out for full deployment.
Azure IoT Suite
There’s no better place to get started than in the suite itself. If you’re reading this blog there’s a good chance you’ll already have an Azure account, and you’ll need one for this, but if you don’t have one it takes just five minutes to sign up. The only thing it will cost is 15 minutes of your time.
On the Azure IoT Suite homepage, you have the option of launching a new solution. Once you click on that tile, you can then choose between two use cases: Predictive maintenance and Remote monitoring. Don’t worry—we’ll be adding more options to meet a wider range of customer needs, but these two core use cases should be enough to get you started.
Select a use case (I chose Remote monitoring) and add a name and a region. The suite then automatically provisions the necessary resources with a single click.
Launching your solution presents you with a generic version of the type of solution you’ve chosen. Obviously, it’s up to you to customise this to meet your own needs, so let’s have a poke under the bonnet.
Map your devices
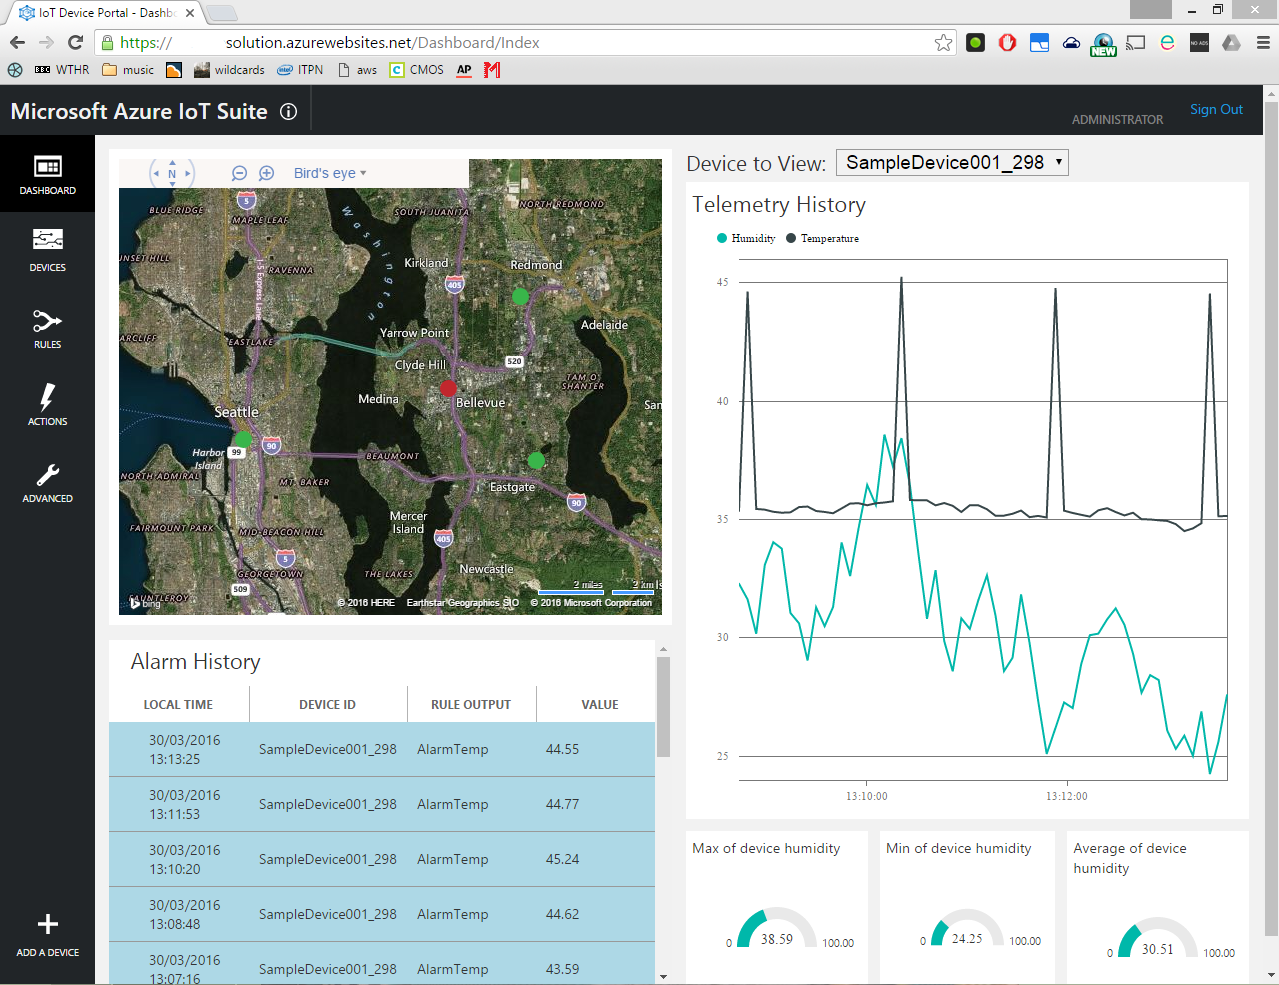
In my environment I get a map showing where my devices are (all around Seattle), some live telemetry from the devices (giving me humidity and temperature data), and a table showing me alarms that have been triggered recently. This data has been sent by virtual devices that are created when you provision your IoT suite.
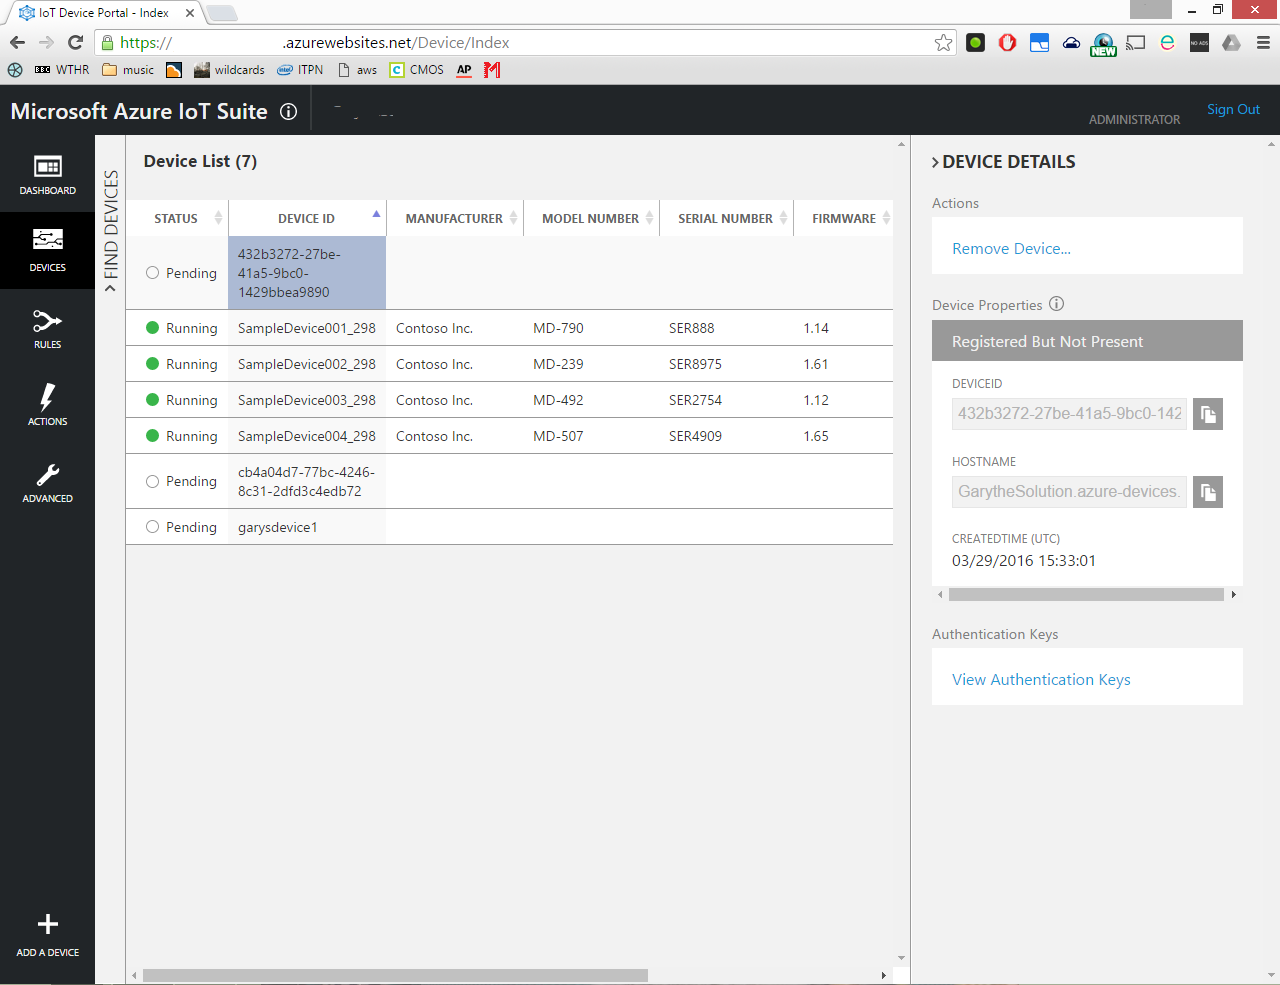
On the left of the Dashboard there’s a tab for devices. Here, you can see what firmware they’re running, what processors they have, even who made them.
Give your devices some commands
Now you’ve heard what your devices have to say, perhaps it’s time to give them some instructions. Click on a device in the Device tab and you’ll see a toolbar pop up on the right. Select Command and you’ll see a dropdown menu with a few example commands to get you started. You can ping a device, change the temperature set point, start and stop telemetry, and so on. Try changing the set point temp (ChangeSetPointTemp) to a value of your choosing. Be aware the values are in Fahrenheit. You’ll notice the request pending, then once it’s completed an item will be added to that device’s Command History.
Give your devices some rules
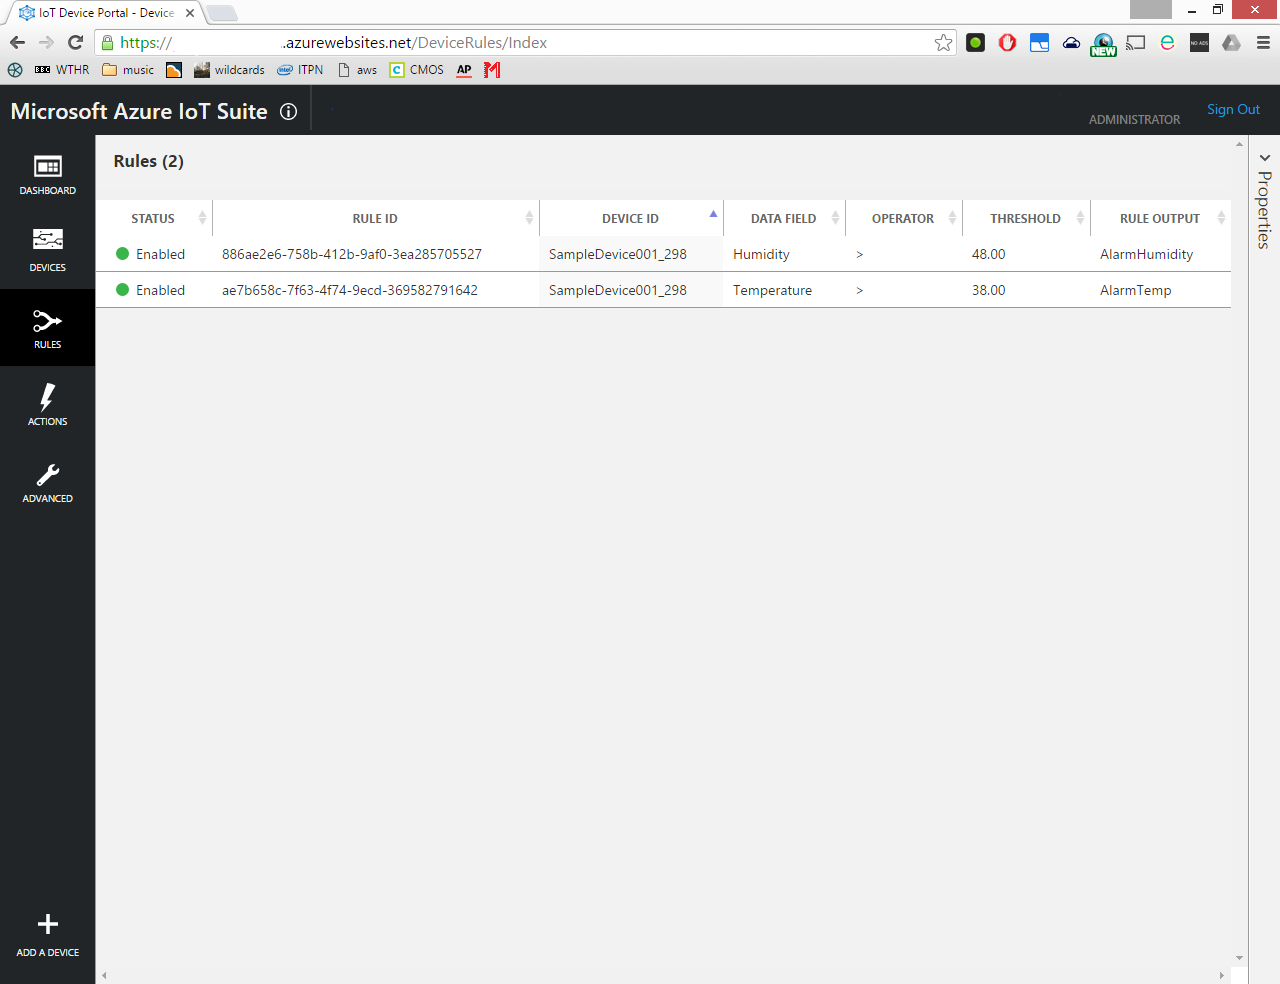
You’ll also find a Rules tab under Devices in the toolbar on the left. Here you can add rules to trigger alarms. These are fairly self-explanatory. You’re just setting an alarm to trigger if a certain condition is met, like if the temperature goes over 45 degrees. Feel free to have a play and see how they work—at this stage you’re not going to break anything. Under the Rules tab you’ve also got an Actions tab, where, unsurprisingly, you can determine what actions are triggered by which rules.
Stream Analytics
What’s actually happening behind this point-and-click interface? Azure is quickly reconfiguring the underlying services that it deployed when you created the environment to respond to your changes. As you change a rule, for example, it’s changing some of the services in a job running in Stream Analytics that’s tracking the incoming values and comparing them to the threshold. It’s a simple service to set up, but at scale it quickly becomes a headache. Connecting Azure Stream Analytics to the IoT hub and all other required services can be complex. The Azure IoT Suite removes this complexity by providing a pre-built solution with all the components connected. For a full rundown on exactly what Azure deploys underneath your IoT solution, check out this article.
So great. You know how hot and humid it is in a fake version of Seattle. Now what?
Well you can start adding your own devices. Fake ones, yes, but real ones too. Click on Add a device at the bottom of the Dashboard toolbar and select Custom Device. Once you give some basic data, the Suite will create a profile for the device and you can then follow the instructions in the pop-out window to start adding your device to your IoT solution. Until the device is configured, its status will display as “Pending” on your dashboard. To add a real device you’ll need to make use of the IoT Hub Client SDKs. These exist across protocols (AMQPS, HTTPS, MQTT…), platforms (Linux, Windows, node.js, RTOS, mbed), and languages (C, C#, JavaScript, Java, and Python) and can all be found on GitHub. This video provides a great 20-minute explanation of how the SDKs work, going into great depth and exploring some of the sample code you can find on GitHub. Alternatively, choose your device from the list here and follow the instructions.
Now we’re straying away from quick setup into more advanced topics, but hopefully now you’ve got a taste you can quickly get your IoT projects up and running.
Resources
- The Azure IoT Suite homepage
- A video intro, covering similar ground to this article
- A video introducing the client SDKs
- There’s also a general dev guide to the IoT hub here.
- The code for the web application that forms the GUI of the dashboard is available on GitHub here, so you’re free to tweak it to match your own needs.