Why open sourced Power BI visuals matter
By Ian Woodgate, managing director of PointBeyond Limited , a UK based SI helping numerous customers to get the most from Power BI.
Power BI has rapidly established itself as a capable and popular BI platform. However, did you know that the built-in visuals that you use are all open source, that you can develop your own, and that there is an active community creating and sharing new ones?
The Microsoft visuals are all built on standards such as HTML5 and CSS3. Not only that, they leverage D3.js – an open source JavaScript library for manipulating documents based on data. It’s worth taking a quick look at the D3 websiteto get a feel for what can be achieved with these technologies.
What open sourcing of Power BI means
The open sourcing of visuals and the use of open standards is a very shrewd move on the part of Microsoft. What is the impact of this?
- Power BI works on a wide range of browsers and devices
- If you need a specific visual you can easily get it built, and the code of Microsoft’s own visuals is available as a starting point
- There is a gallery of Microsoft and community developed custom visuals that can freely be downloaded and used
- We can expect to see an explosion of community developed visuals that are readily available to share
- There will likely soon be a visual in Power BI to cover most common business scenarios, and probably a fair number of the less common ones
Potential challenges
Challenges may also arise of course – such as ensuring custom visuals remain compatible with the rapidly evolving Power BI platform, selecting the best visuals given a large choice (think choosing an app in an app store), and ensuring that only high quality visualisations are shared and used.
Custom visuals
The custom visuals available at the time of writing are shown below:
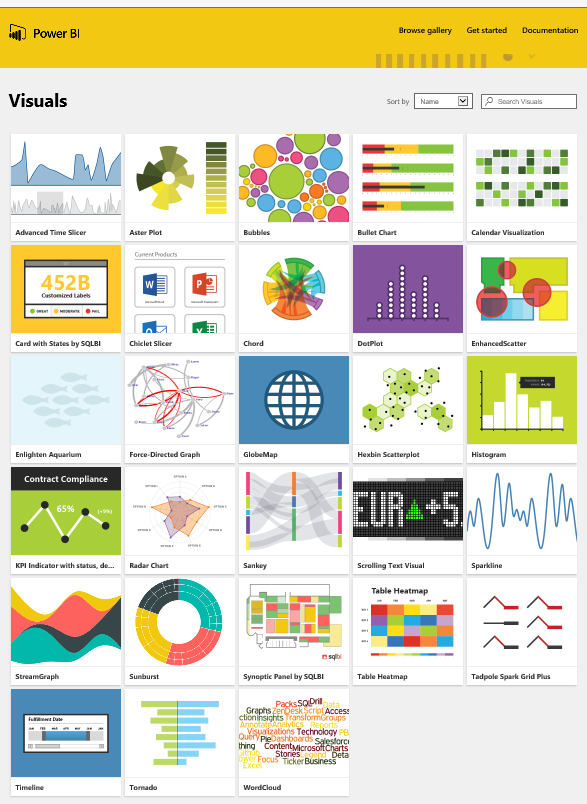
The latest list can be found on the Power BI website.
Using custom visuals
Making use of a custom visual is pretty straightforward. This video shows you how:
[View:https://www.youtube.com/watch?v=KVo1N_LXG9s&feature=youtu.be:0:0]
In the video, I have imported the custom visuals into the Power BI desktop, and placed them into pages of a report. Once this is done the report can be published to the Power BI Servicein the normal way. Equally, it is possible to import custom visuals directly into the Power BI Service in much the same way as shown in the video.
To find out more about how to write your own custom visuals, or to look at the source code of the existing ones, check out the PowerBI-visuals project on GitHub.