The Data Analysts Toolkit: Why are Excel and R useful together, and how do we connect them?

This article was commissioned by Jen Stirrup a SQL Server fan and Microsoft MVP which a passion for Business Intelligence and Data Virtualisation.
Why is analytics interesting? Well, companies are starting to view it as profitable. For example, McKinsey showed analytics was worth 100Bn today, and estimated to be over 320Bn by 2020.
When I speak to customers, this is the ‘end goal’ – they want to use their data in order to analyse and predict what their customers are saying to them. However, it seems that folks can be a bit vague on what predictive modelling actually is.
I think that this is why Power BI and Excel are a good mix together. It makes concepts like Predictive Modelling accessible, after a bit of a learning curve. Excel is accessible and user-friendly, and we can enhance our stats delivery using R as well as Excel.
One area of interest is Predictive Modelling. This is the process of using a statistical or model to predict the value of a target variable. What does this actually mean? Predictive modelling is where we work to the predict values in new data, rather than trying to explain an existing data set. To do this, we work with variables. By their nature, these vary; if they didn’t, they would be called a constant.
One pioneer was Francis Galton, who was a bit of an Indiana Jones in his day. Although he wrote in the 19th century, his work is considered good and clear enough to read today. Therefore, this research has a long lineage, although it seems to be a new thing. We will start with the simplest: linear regression.
Linear regression compares two variables x and y to answer the question, “How does y change with x?” For predictive modelling, we start out with what are known as ‘predictor variables’; in terms of this question, this would be x. The result is called the target variable. In this question, this would be y. Why would we do this?
- Machine Learning
- Statistics
- Programming with Software
- Programming with Data
- Fun!
Why would businesses work with it at all?
- to discover new knowledge and patterns in the data
- to improve business results
- to deliver better customised services
If we have only one predictor variable and the response and the predictor variable have a linear relationship, the data can be analyzed with a simple linear model. When there is more than one predictor variable, we would use multiple regression. In this case, our question would be: , “How does y change with multiple x?”
In fitting statistical models in which some variables are used to predict others, we want to find is that the x and y variables do not vary independently of each other, but that they tend to vary together. We hope to find that y is varying as a straight-line function of x.
If we were to visualise the data, we would hope to find a pleasing line chart which shows y and x relating to each other in a straight line, with a minimal amount of ‘noise’ in the chart. Visualising the data means that the relationship is very clear; analysing the data means that the data itself is robust and it has been checked.
I think that’s why, in practice, Power BI, Excel and R work well together. R has got some great visualisations, but people are very comfortable with Excel for visualisations. All that loading packages stuff you have to do in R… it doesn’t work for everyone. So we use R and Excel, at a high level, as follows:
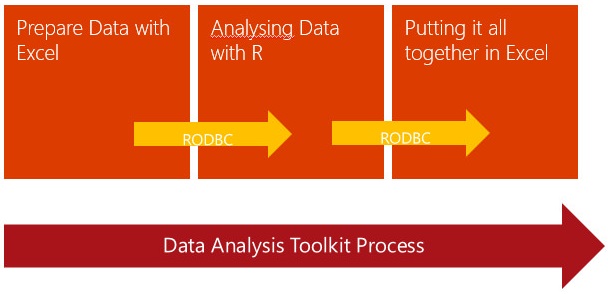
- We cleanse and prepare data with Excel or Power Query
- We use RODBC to load data into R
- We analyse and verify the data in R
- We build models in R
- We load the data back into Excel using RODBC
- We visualise the data for results
Excel is, after all, one of the world’s most successful software applications ever, with reputedly over one billion users. Using them both together means that you get the best of both words: R for analysis and model building: Excel is the ‘default’ for munging data around, and visualising it. I’m sure that one of the most popular buttons on software such as Tableau, QlikView et al is the ‘Export to Excel’ or ‘Export to CSV’ functionality. I’d be interested to know in what people think about that!
Building linear regression models in R is very simple; in our next session, we will look at how to do that, and then how to visualise it in Excel. Doing all this is easier than you think, and I will show you how.
Article originally written for Jen's Blog.