Guest Post: How to Configure Alerts in System Center 2012
By Robert Marshall - Consultant at SMSMarshall
In this article I will cover key areas of the enhancements to the Alerts feature that come with System Center 2012 Configuration Manager Service Pack 1 , primarily the ability to send emails when Alerts have been triggered for non-Endpoint Protection Alerts. We will accomplish this in a guide form, and go over configuring a site server and triggering an alert so that the email notification is sent which we can then view.
Email notification came into System Center Configuration Manager due to the inclusion of Endpoint Protection, which at the time was the sole component that email notifications could be configured for. In service pack 1 this has been extended across several areas of the product and is no longer just an anti-virus email notification system.
We can now set subscriptions on all the Alerts that are available and target multiple recipients with email notifications as a result. Most of the alerts provide a percentage that governs how low the measurement can go before the alert is trigged. This allows the alert to be fine-tuned and a baseline for notification defined. For further information on alerts visit the documentation library.
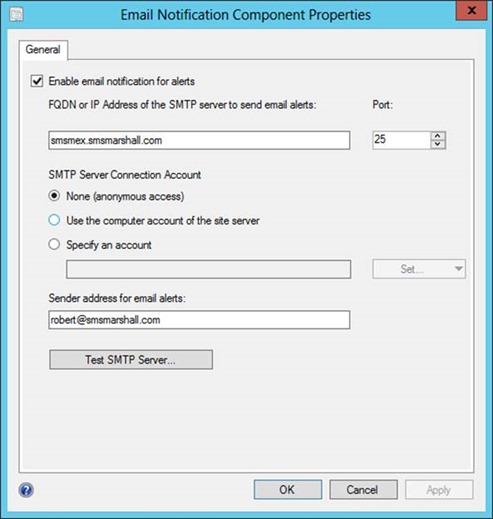
Before we can use the email notification feature we need to switch it on and configure it. Open the System Center 2012 Configuration Manager Console to begin.
Navigate to Administration > Overview > Site Configuration > Sites, Select Configure Site Components on the Ribbon and then select Email Notification
After enabling email notification for alerts and filling in the dialogs properties click Test SMTP Server to perform a quick test. If you encounter failure here review your settings, make sure firewalls are not getting in the way (SMTP port 25) and that the account you have specified, if not using anonymous and configured for it, has adequate rights to use the SMTP server.
We're not able to create alerts for everything happening in ConfigMgr, there are other alerts that can be generated, such as from the migration feature, but we can enable alerts for the following objects so far documented or discovered:
Site server Alerts |
Deployments Database replication Database (drive capacity) Low sideloading activations (Windows 8) |
Site System Alerts |
Software Update Point Management Point |
Client Health Alerts |
Client check pass or no results for active clients falls below threshold Client remediation success falls below the threshold Client activity falls below threshold |
Endpoint Protection Alerts |
Malware is detected The same type of malware is detected on a number of computers The same type of malware is repeatedly detected within the specified interval on a computer Multiple types of malware are detected on the same computer with the specified interval |
The last two category of alert are handled differently than the first two, these alerts are created and configured at the collection level. I've not focused on these types of alerts but for further information visit the documentation library.
Ok let's proceed to test the email notification feature using the management point alert.
You will find the option to enable the management point for alerts in the management point roles properties itself, which can be found under Administration > Overview > Site Configuration > Servers and Site System Role, simply select the site server containing the role, select the management point role itself, select properties from the ribbon and finally select Generate alert when the management point is not healthy. Once the management point is configured for alerts, the alert itself should show in the alerts view.
Navigate to Monitoring > Overview > Alerts > All Alerts to view the newly configured alert
To get an email notification sent out we'll subscribe to the new alert (highlighted above) in readiness for the alert to be triggered.
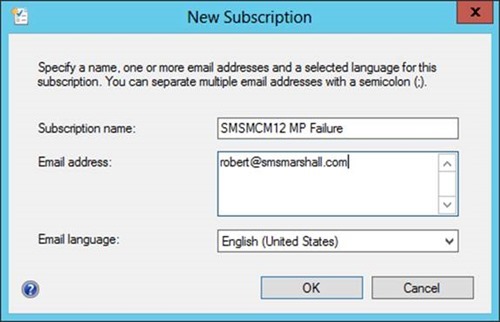
Select the new alert and then select the Create subscription button on the ribbon.
It will be important to create a standard around the subscription name, for my example I've placed the server name and the role type in the subscription name for easy reference in the console. The Email address field is semicolon delimited and thus can be loaded with multiple recipients. For further information on configuring a subscription refer here and expand the To subscribe to alerts section.
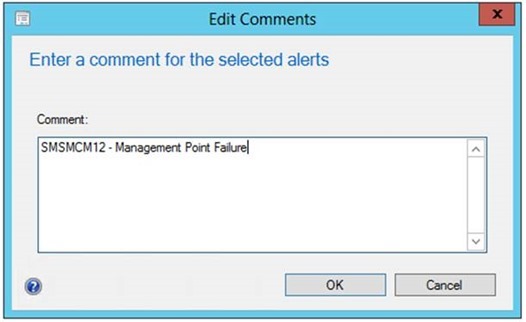
We now configure the alert with a comment, this comment is included in the email notification and we can use this to provide some further information about the alert to the recipients.
Select the new alert and Select Edit Comments from the ribbon and enter some details:
Note that I have included the management point server name and that mentioned that it is a management point failure being monitored, this is useful for later on as the comment is mentioned in the email to the recipients.
Now navigate to Monitoring > Overview > Alerts > Subscriptions
From this view we can see all the available subscriptions configured so far, and in this screenshot we have a solitary subscription created from the previous steps. Any recipients on the delimited email address list will now receive an email notification once the alert has been triggered.
To trigger the alert we can cause the management point to fail simply by stopping the SMS Agent Service on the site server hosting the role. The SMS_MP_CONTROL_MANAGER component on the site server checks the status of the management point every five minutes, you can monitor the MPCONTROL.LOG on the site server to see when this event takes place. Obviously you would do this on a non-production management point and not risk inducing a brief production outage. Now let's head back to the alerts node
Navigate to Monitoring > Overview > Alerts > Active Alerts
Alerts are handled with high priority, within moments of the component noticing that the role is unhealthy we see an alert appear in the console:
We can see here that the alert state is Active which means the management point is most likely still down, we also get the time the alert was created or last modified.
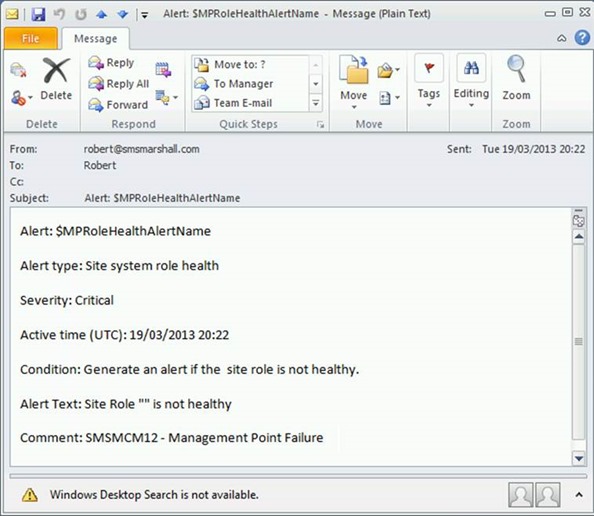
My mailbox received an email almost immediately after:
As you can see in the above screenshot the alert name isn't being converted from its token-form into the name of the alert and the alert text hasn't expanded the role name, there is a DCR logged for this on connect, but the comment was passed down properly and we can now tell from the Alerts email notification which management point failed, and it all happened in near real-time. Of course there could be latency involved here and a delay in the email being sent due to a busy Exchange server, or a very busy site server, but these alerts should get triggered the moment a status message is created and processed on the site server.
To resolve the alert I simply restart the SMS Agent Host service and wait for the 5 minute Management point periodic health check to take place and for the SMS_MP_CONTROL_MANAGER component to report that the management point is healthy again, at which point the alert will be switched to the cancelled state.
An alerts state is useful diagnostic information. For some of these alerts, the alert state shouldn't change for several months, for example the database warning and critical alerts most likely will never be triggered, but if it they are, and the issue is resolved, you can see from the alert state that the alert was triggered and then Cancelled. Thereafter the alert will not show as Never Triggered unless the alert is recreated. It would be a good idea to set subscriptions on the database related alerts.
To test alerts further, either configure deployments that are destined to fail then configure the alert and create a subscription, or test using the Low Client remediation rate alert and exclude some of the clients assigned to your site from automatic remediation, setting the alerts success percentage to 100% and then causing client failure by stopping the SMS Agent Host or BITS service and running CCMEVAL from the clients installation folder. The client health check will report back to the site server which in turn will trigger the alert. You can find further information on how to exclude computers from automatic remediation in the documentation library.
Overall this new feature gives us a little more monitoring capability straight out of the box. I’m looking forward to the growth that will take place in this area of the product over coming releases.
About the Author
 Robert Marshall an IT professional who specialises in System Center 2012 Configuration Manager, is based in the City of London and works as a Consultant for SMSMarshall. He has been an MVP for 5 years and is a founder of the Windows Management User Group.


