A Day at the SPA
Note: “A Day at the SPA” is the first in series for updates and republish of “Tspring’s Greatest Hits” blogs from https://blogs.technet.com/ad . Updates for applicability in newer products added.
Ah, there’s nothing like the stop-everything, our-company-has-come-to-a-complete-halt emergency call we sometimes get where the domain controllers have slowed to a figurative crawl. Resulting in nearly all other business likewise emulating a glacier as well owing to logon and application failures and the like.
If you’ve had that happen to one of your domain controllers then you are nodding your head now and feeling some relief that you are reading about it and not experiencing that issue right this moment.
The question for this post is: what do you do when that waking nightmare happens (other than consider where you can hide where your boss can’t find you)?
Well, you use my favorite, and the guest of honor for this post: Server Performance Advisor. Otherwise known as SPA.
The original “SPA” was a not installed or available in Windows. Instead, it needed to be download (link below) for Windows Server 2003. Windows Server 2008 and later come with the functionality of Server Performance Advisor baked into Performance Monitor (easily launched from Start—>Run and entering PerfMon.msc). When Active Directory Directory Services (ADDS) are installed on a server the “Active Directory Diagnostics” data collector set in performance monitor is also installed automatically.
The functionality in Performance Monitor’s “Data Collector Sets” is basically the same as in SPA. For the purposes of this blog post I’ll use acronym “SPA” to mean Server 2003 SPA or the AD/ADLDS Data Collector Sets in Server 2008 and later Performance Monitor.
Think of SPA as a distilled and concentrated version of the Perfmon performance logging and tracing data you might review in this scenario. Answers to your questions are boiled down to what you need to know; things that are not relevant to Active Directory performance aren’t gathered, collated or mentioned. SPA may not tell you the cause of the problem in every case, but it will tell you where to look to find that cause.
Furthermore, the Active Directory Diagnostics data collector set has heuristics which will review what your server is doing versus what would be considered excessive given the performance capabilities of the hardware or allocated resources. For example, understanding if your server is running out of ATQ threads to handle LDAP queries is a calculated thing and SPA can sum things up nicely for you.
To start SPA simply right click the data collector set and choose Start.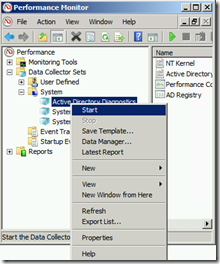 The data collector set will show a green “Play” symbol on the data collector set icon while it is running.
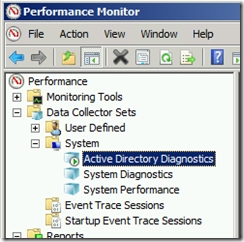 When the data collection is finished running and after the report is finished compiling you can find the viewable report in the Reports node in the left hand tree.
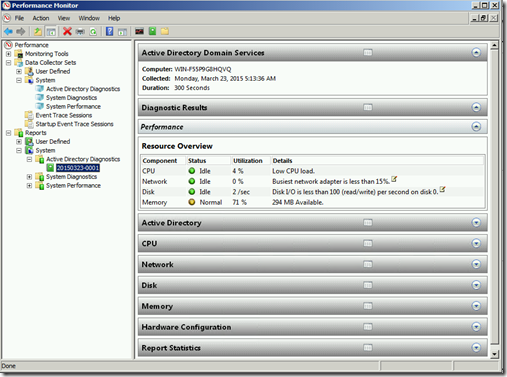 The report will be named after the date it was ran and an incremental number for how many were ran that day. To export the report for viewing simply click the folder icon above (it says “Open Data Folder”) and zip up all of the files in that directory.
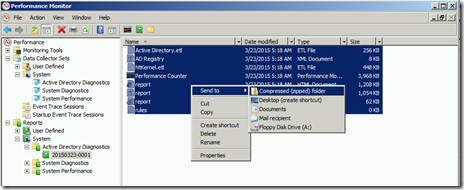
So I’ve talked about the generalities of SPA, now let’s delve into the specifics. Well, not all of them, but an overview and the highlights which will be most useful to you.
SPA’s AD data collector is comprised of sections called Performance Advice, Active Directory, Application Tables, CPU, Network, Disk, Memory, Tuning Parameters, and General Information. For the 2008 and later data collectors the categories are Performance, Active Directory, CPU, Network, Disk, Memory, Hardware Configuration and Report Statistics.
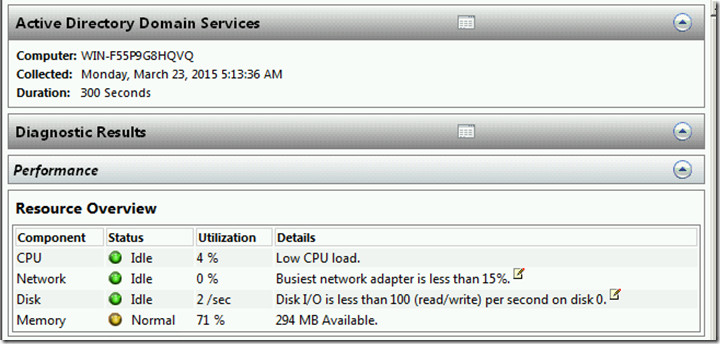
Before you reach all of the hard data in those sections, though, SPA gives you a summary at the top of the report. It’ll look something like this:
Performance Advice is pretty self explanatory and is one of the big benefits of SPA over other performance data tools. It’s a synopsis of the more common bottlenecks that can be found with an assessment of whether they are a problem in your case. Very helpful. It looks at CPU, Network, Memory and Disk I/O and gives a percentage of overall utilization, it’s judgment on whether the performance seen is idle, normal or a problem and a short detail sentence that may tell more.
The Active Directory portion gives good collated data and some hard numbers on AD specific counters. These are most useful if you already have an understanding of what that domain controllers baseline performance counters are. In other words, what the normal numbers would be for that domain controller based on what role it has and services it provides day to day. Generally speaking, though, SPA is most often used when a sudden problem has occurred, and so at that point establishing a baseline is not what it should be used for.
The good collated data includes a listing of clients with the most CPU usage for LDAP searches. Client names are resolved by FQDN and there is a separate area which gives the result of those searches.
AD has indices for fast searches and those indices can get hammered sometimes. The Application Tables section gives data on how those indices are used. The information this gives to you can be used to refine queries being issued to the database (if they were to traverse too many entries to get you a result for example) if you have an application that is doing that sort of thing, it can suggest that you need to index something new, or that you need to examine and perhaps fix your database using ntdsutil.exe.
The CPU portion gives a good snapshot of the busiest processes running on the server during the data gathering. Typically, this would show LSASS.EXE as being the busiest on a domain controller, but not always-particularly in situations where the domain controller has multiple jobs (file server, application server of some kind perhaps). Generally speaking, having a domain controller be just a domain controller is a good thing.
Note: If Idle has the highest CPU percentage then you may want to make sure you gathered data during the problem actually occurring.
The Network section is one of the most commonly useful ones. Among other things, this summarizes the TCP and UDCP client inbound and outbound traffic by computer. It also tells what processes on the local server were being used in conjunction with that traffic. Good stuff which can give a “smoking gun” for some issues. The remaining data in the Network section is also useful but we have to draw the line somewhere or this becomes less of a blog post and more like training.
The Disk and Memory sections will provide very useful data, more so if you have that baseline for that system to tell you what is out of the normal for it typically.
SPA is a free download from our site, and installs as a new program group. Here’s where you can get it (install does not require a reboot):
A few other things to discuss regarding SPA.
- For the Server 2003 Server Performance Advisor: It requires Server 2003 to run.
- As I stated above, when you have a problem is the worst time to establish a baseline. SPA and the data collector set uses should be should be used to look for problems which are underway at the current time.
- The default duration of the data collection is 300 seconds (5 minutes). The duration of the test can be altered depending on your issue. Keep in mind that if you gather data a great deal longer than the duration of the problem then you run the risk of averaging out the data and making it less useful for troubleshooting.
- For Windows Server 2008 and later Data Collector Sets: Once the Active Directory Directory Services (ADDS) role is installed the Active Directory Diagnostics data collector set is also installed and available.
- For the Server 2003 Server Performance Advisor: :In the same way that there are ADAM performance counters, SPA has an ADAM data collector
- For Windows Server 2008 and later Data Collector Sets: When Active Directory Lightweight Directory Services is installed an additional ADLDS data collector is also installed.
- For the Server 2003 Server Performance Advisor: The latest version (above) includes an executable that can kick this off from a command line and it can be run remotely via PsExec or similar.
- SPA will not necessarily be the only thing to do in emergency scenarios but it’s a great starting place to figure out the problem.
- When a data collection is finished it will then compile the data report for review. If the server was very busy during the data collection-as is likely since why else would you be running it?-it may take awhile for the report to be compiled. The time to compile the report often takes longer than the data collection duration itself on busy servers.
See? A day at the SPA can really take the edge off of a stop-everything, our-company-has-come-to-a-complete-halt emergency kind of day. Very relaxing indeed.
