Microsoft Loves Linux Deep Dive #9: Monitoring Open Source Middleware
This post was written by Michael Kelley, Principal PM Manager, Cloud + Enterprise team.
This blog post is #9 in a series of technical posts about running and managing Linux and FreeBSD in your on-premises datacenter. Other posts in the series are here:
Overview
Running Linux and FreeBSD as a guest operating system on Hyper-V
- Microsoft Loves Linux Deep Dive #1: Introduction to Linux and FreeBSD on Hyper-V
- Microsoft Loves Linux Deep Dive #2: Linux and FreeBSD Integration Services Core Features
- Microsoft Loves Linux Deep Dive #3: Linux Dynamic Memory and Live Backup
- Microsoft Loves Linux Deep Dive #4: Linux Network Features and Performance
- Microsoft Loves Linux Deep Dive #5: FreeBSD Overview and Status
Managing Linux and UNIX using System Center and PowerShell DSC
- Microsoft Loves Linux Deep Dive #6: Linux and UNIX Systems Management Overview
- Microsoft Loves Linux Deep Dive #7: Managing Linux in System Center Virtual Machine Manager
- Microsoft Loves Linux Deep Dive #8: Linux and UNIX Monitoring with Operations Manager
- Microsoft Loves Linux Deep Dive #9: Monitoring Open Source Middleware
- Microsoft Loves Linux Deep Dive #10: Managing the Software Configuration on Linux and UNIX Servers
- Microsoft Loves Linux Deep Dive #11: Linux Configuration Management with PowerShell DSC
- Microsoft Loves Linux Deep Dive #12: Summary of Running and Managing Linux and FreeBSD in Your Datacenter
Monitoring Open Source Middleware with System Center Operations Manager
As described in the previous post, Operations Manager provides a monitoring framework, with specific monitoring capabilities provided by management packs that plug in to the framework. In addition to management packs for base level Linux and UNIX operating system monitoring, Microsoft also provides management packs for key middleware components such as Java applications servers, and in the 2016 release, for Apache HTTP web servers and for MySQL/MariaDB database servers. Partners provide management packs for other software packages that you may be running. You can even write your own management pack. Using a combination of these management packs for the base operating systems and middleware components can give you a holistic view of the health and performance of the applications and services that your business depends on.
Java Application Server Monitoring
Microsoft provides management packs for the top four Java application servers: Apache Tomcat, Red Hat JBoss/Wildfly, Oracle WebLogic, and IBM WebSphere. You can monitor these application servers running on a variety of Linux and UNIX operating systems, and also running on Windows. The management packs discover instances of these application servers, and initially provide basic information and health monitoring of the application server.
Via these management packs, Operations Manager also offers “deep monitoring” of a Java application server by installing a Microsoft-provided Java servlet called “BeanSpy” into the application server. BeanSpy connects to the MBean store via the standard JMX (Java Management Extension) interface to retrieve more detailed information about the health and performance of the application server. With deep monitoring enabled, Operations Manager can monitor the memory usage, garbage collection rates, and the running applications (.war files and .ear files) on the application server, including their running or stopped state. BeanSpy is written in Java and is available as open source on GitHub.
The Java application server management packs also include a template to make it easy to create custom health and performance monitors based on MBean properties or MBeans operations from the MBean. The MBeans may be from the Java application server itself, or from a Java application running on the application server. Using the template wizard in the OpsMgr console, you can navigate the MBean store, choose an MBean and property/operation on the MBean, and create a custom monitor. If your application developers are using JMX for Java application instrumentation, this template allows you to easily build monitoring based on that custom instrumentation. As an example, let’s say you have a Java application with an internal queue, and a queue size over 50 indicates a performance bottleneck. If the application uses JMX to maintain an MBean with the queue size, you can easily create a custom monitor to generate an alert if the queue size exceeds 50.
The architecture of BeanSpy interaction with the Java application server is captured in the diagram below.
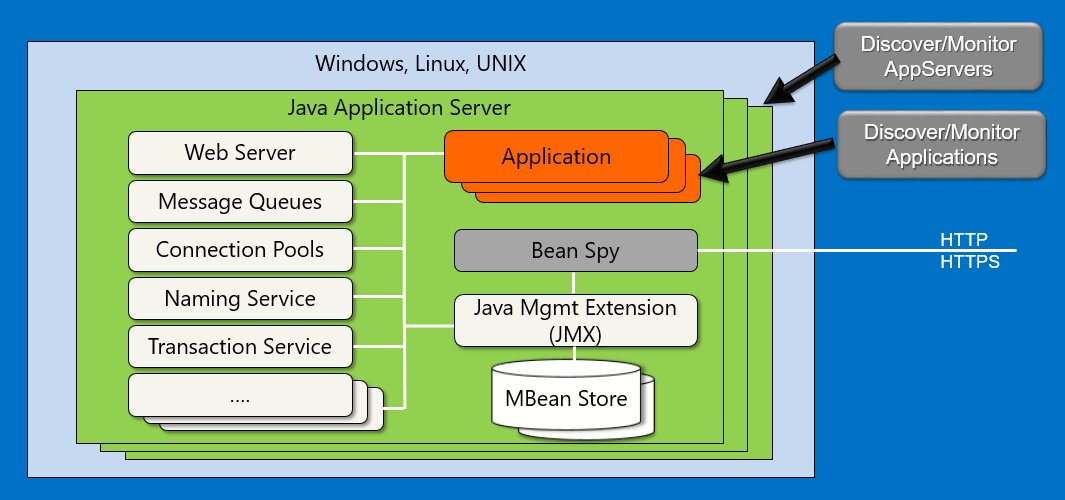
BeanSpy is accessed as a servlet on the standard application server URL and port number via HTTP or HTTPS, and is subject to the same security controls as other applications.
This blog post is a detailed walkthrough of monitoring a standalone JBoss application server. The Java application server management packs also recognize clustered configurations. This blog post is a detailed walkthrough of monitoring JBoss/Wildfly in domain mode, which is a clustered configuration.
Apache Web Server Monitoring
In order to provide full monitoring for LAMP stack applications, System Center 2016 Operations Manager includes a Microsoft-written management pack for the Apache HTTP web server. With the Apache management pack, you can discover installed instances of the Apache HTTP web server, monitor the Apache server, monitor virtual hosts, and monitor SSL certs used by Apache. The monitoring includes the overall health of the server, statistics on number of requests, and consumption of CPU and memory. The SSL cert monitoring tells you when the cert will expire, and generates an alert as the expiration date approaches so that you can be sure to renew the cert before its expiration causes your site to be non-operational. For end-to-end monitoring, the management pack defines a set of optional URL monitors and rules to monitor the health and performance of your web applications from the perspective of a remote user.
The implementation of the Apache HTTP web server monitoring has two parts: a standard Apache module, and an OMI CIM provider. The Apache module follows the Apache module architecture and conventions, leverages the Apache APR, and registers with the Apache server like any other module, such as mod_php, mod_status, mod_ssl, etc. It runs in the Apache server process and gathers real-time data on requests, performance, and configuration.
The OMI CIM provider follows the standard provider model for the OpsMgr agent and plugs into the OMI server like any other provider. The Apache CIM provider gets data from the Apache module through a shared memory segment, and reports the data back to OpsMgr like the other providers. The overall architecture is depicted below.
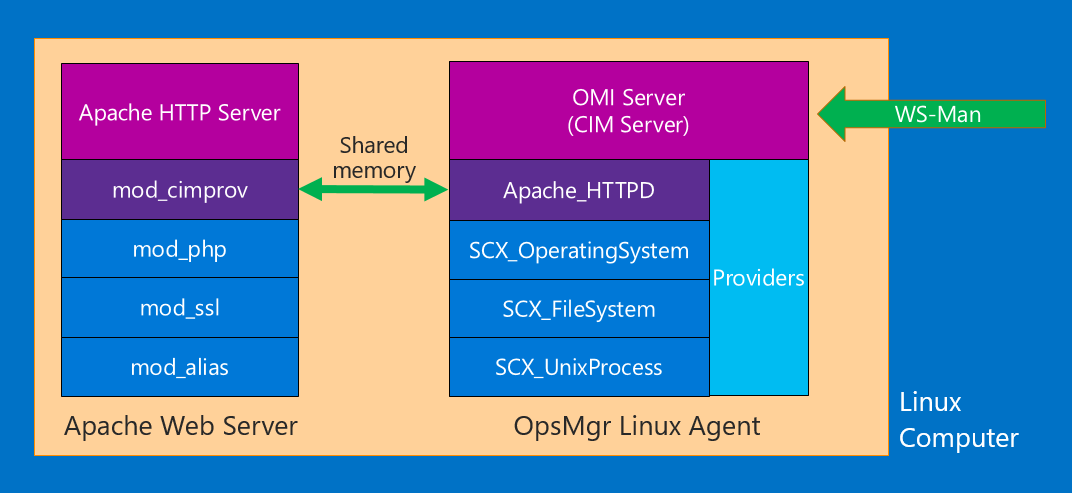
The Apache_HTTPD OMI provider and the Apache module mod_cimprov are both open source on GitHub.
This blog post gives a short walkthrough of monitoring an Apache web server with Operations Manager.
MySQL Database Server Monitoring
Similarly, System Center 2016 Operations Manager includes a Microsoft-written management pack for the MySQL database server (and the compatible MariaDB) in order to complete the ability to monitor LAMP stack applications. The MySQL management pack discovers instances of MySQL/MariaDB on Linux computers. It monitors the health of the server, and reports performance metrics for the key cache, query cache, table cache, and optional InnoDB buffer pool hit rate and usage statistics. It provides monitoring of disk space usage for the whole server as well as individual databases.
MySQL monitoring uses a new OMI CIM provider that follows the standard provider model for the OpsMgr agent and plugs into the OMI server like any other provider. The provider connects to the MySQL server using the MySQL client libraries, and retrieves health and performance information from the running server. In order for the MySQL OMI CIM Provider to connect using the MySQL client libraries, user credentials must be specified to authorize the connection. The user in this case needs minimal access to the MySQL virtual tables that are queried to gather monitoring data. More details on this user can be found in the Management Pack Guide. An architectural overview can be seen below.
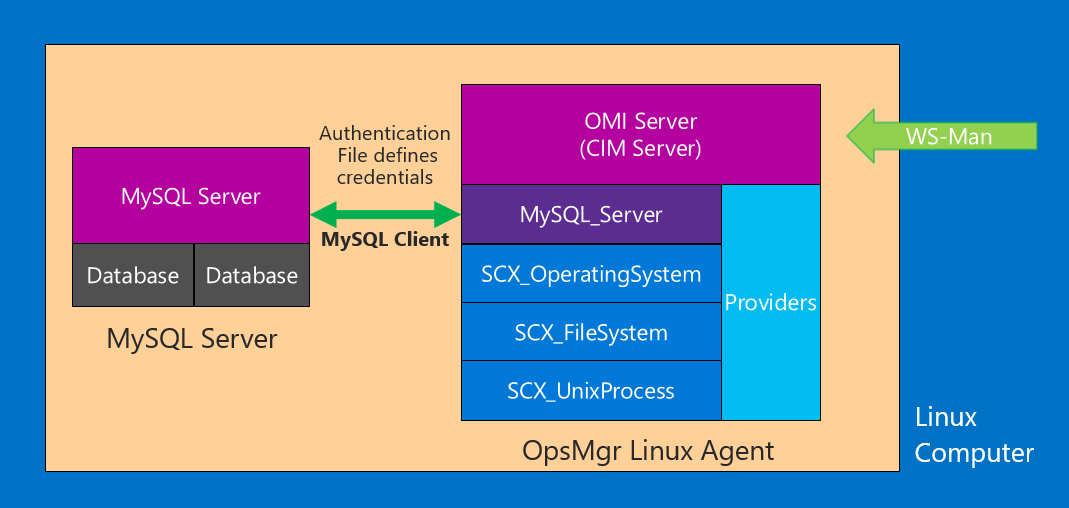
The MySQL_Server OMI provider is open source on GitHub.
This blog post gives a short walkthrough of monitoring a MySQL database server with Operations Manager.
Other Management Packs
Microsoft documents how to create your own management packs, leading to an eco-system of management packs created by companies and organizations other than Microsoft. These management packs provide monitoring of key software that you likely use in your datacenter. Some of the management packs are free from the community, and others are produced by commercial software companies and are licensed. These partner management packs cover a variety of important software, including:
• Oracle database
• IBM DB2 database
• IBM AS/400
• IBM zOS
• Linux on IBM System z
• VMware ESX
Many such partner offerings are listed in the Microsoft Pinpoint catalog here. Search for “management pack”.
You can also create your own management packs as an end customer. While there is a learning curve to understand the concepts and techniques for building a good management pack, with that knowledge you can build sophisticated monitoring for custom applications your organization runs, or go beyond the monitoring capabilities provided by Microsoft or partners.
Summary
With the existing Java application server management packs, and the new Apache web server and MySQL database server management packs in System Center 2016, System Center Operations Manager can now monitor the Java and LAMP stack applications you run on Linux. Partners also provide management packs for other operating systems and other widely used commercial software, such as Oracle databases. This range of management packs, plus the ability to create your own management packs, gives you broad coverage of the key applications and services that you run in your datacenter.
In the next blog post, I’ll take a look at getting hardware inventory and software inventory information from Linux and UNIX servers, and doing software distribution to Linux and UNIX. These functions are performed by System Center Configuration Manager.