Microsoft Loves Linux Deep Dive #8: Linux and UNIX Monitoring with Operations Manager
This post was written by Michael Kelley, Principal PM Manager, Cloud + Enterprise team.
This blog post is #8 in a series of technical posts about running and managing Linux and FreeBSD in your on-premises datacenter. Other posts in the series are here:
Overview
Running Linux and FreeBSD as a guest operating system on Hyper-V
- Microsoft Loves Linux Deep Dive #1: Introduction to Linux and FreeBSD on Hyper-V
- Microsoft Loves Linux Deep Dive #2: Linux and FreeBSD Integration Services Core Features
- Microsoft Loves Linux Deep Dive #3: Linux Dynamic Memory and Live Backup
- Microsoft Loves Linux Deep Dive #4: Linux Network Features and Performance
- Microsoft Loves Linux Deep Dive #5: FreeBSD Overview and Status
Managing Linux and UNIX using System Center and PowerShell DSC
- Microsoft Loves Linux Deep Dive #6: Linux and UNIX Systems Management Overview
- Microsoft Loves Linux Deep Dive #7: Managing Linux in System Center Virtual Machine Manager
- Microsoft Loves Linux Deep Dive #8: Linux and UNIX Monitoring with Operations Manager
- Microsoft Loves Linux Deep Dive #9: Monitoring Open Source Middleware
- Microsoft Loves Linux Deep Dive #10: Managing the Software Configuration on Linux and UNIX Servers
- Microsoft Loves Linux Deep Dive #11: Linux Configuration Management with PowerShell DSC
- Microsoft Loves Linux Deep Dive #12: Summary of Running and Managing Linux and FreeBSD in Your Datacenter
Linux and UNIX Monitoring with System Center Operations Manager
System Center Operations Manager (OpsMgr) provides day-to-day operational monitoring of Windows, Linux, and UNIX operating systems, network routers & switches, and the applications you are running on that infrastructure. Operations Manager itself is a framework that runs on Window servers, providing a variety of services including core mechanisms for doing monitoring, an operator interface, a data warehouse for storing historical data, and a reporting infrastructure. Specific monitoring capabilities are provided by management packs that plug into this framework and implement monitoring for operating system and workloads. Microsoft provides many management packs for standard workloads, and customers and 3rd parties can create their own management packs to extend what Microsoft provides out-of-the-box.
In this context, Microsoft provides out-of-the-box management packs for Linux and UNIX operating systems. These management packs implement a variety of capabilities, including:
Core operating system health and performance monitoring, with customizable thresholds and alerting
Templates, which are wizards in the OpsMgr user interface, for quickly building custom health and performance monitors for the operating system or your applications
Diagnostics and recoveries, which are tasks that execute command lines on the target Linux or UNIX system to provide more information when a problem occurs, or to remediate the problem.
Built-in reports for viewing historical data, spotting trends, etc. You can also build custom reports.
Audit Collection Services to monitor your Linux and UNIX servers for relevant security events and to merge that event stream with similar events from Windows servers
All of the functionality provided by the Linux/UNIX management packs is available in the OpsMgr console, right alongside Windows functionality. It is also available via scripting using PowerShell against the central OpsMgr server infrastructure.
How Does Operations Manager Monitor Linux and UNIX?
The monitoring process begins in the OpsMgr console (or via PowerShell command line) with discovering and bringing the Linux/UNIX computer under management. This process installs the OpsMgr agent on the target Linux/UNIX computer. As shown in the diagram below, installing the agent and any subsequent agent maintenance actions (such as upgrading the agent, stopping and restarting the agent, or uninstalling the agent) are done from OpsMgr using the ssh protocol communicating with the standard sshd daemon running on the Linux/UNIX computer. Alternatively, IT organizations may choose to install the OpsMgr Linux/UNIX agent and do agent maintenance actions using other tools outside of OpsMgr. In that case, the ssh protocol and sshd are not used by OpsMgr at all.
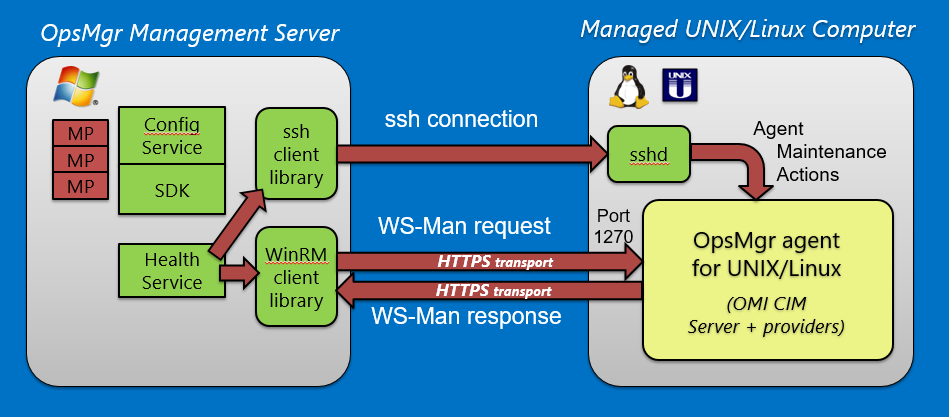
The OpsMgr agent for Linux/UNIX consists of the Open Management Infrastructure (OMI) server plus a set of providers written by Microsoft. OMI is an implementation of Common Information Model (CIM) standards, analogous to Windows Management Instrumentation (WMI) in Windows. OMI is an open source project available here from The Open Group. The source code for the Microsoft-written providers, along with instructions on rebuilding the agent from source code, is also available here from CodePlex.
For ongoing monitoring of the Linux/UNIX computer, the OpsMgr management server makes requests to the agent on the Linux/UNIX computer using the WS-Management protocol over HTTPS on TLS. The OMI server fields the incoming WS-Man request and determines which provider to invoke. The provider gathers the raw data from the Linux/UNIX operating system using system calls, ioctls, the /proc pseudo-file system, or UNIX-specific libraries like kstat or perfstat. In order to minimize the performance impact of the data gathering and reduce fragility, the agent does not invoke Linux/UNIX commands and parse the text output. The raw data is returned through the OMI server back to the OpsMgr management server. This data is processed by the Health Service and management packs on the OpsMgr management server to determine entity health and to record performance information. If warranted, alerts are generated based on the data.
The architectural approach to monitoring Linux and UNIX is different from the approach to monitoring Windows. On Windows, the agent includes a full Health Service implementation, allowing the management pack processing to be done on each managed Windows server. The Windows agent can also cache data for later transmission in case the network connection to the OpsMgr management server is temporarily interrupted. By contrast, the Linux/UNIX agent is lighter weight and does no significant processing of the data, so it has a smaller footprint on the managed Linux/UNIX computer. The tradeoff is more work on the OpsMgr management server, which can require more management servers to monitoring an equivalent number of Linux/UNIX computers. Also, data from Linux/UNIX computers will be dropped if the network connection to the OpsMgr management server is interrupted for any length of time.
Out-of-the-box Monitoring
The Linux/UNIX management packs provide out-of-the-box monitoring in these areas:
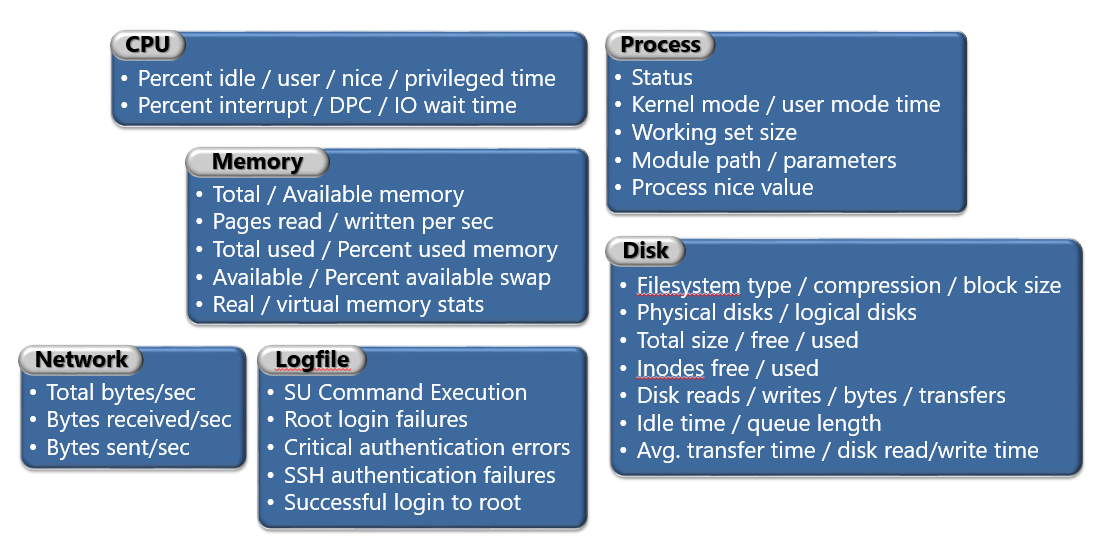
As much as possible, the information is normalized to be equivalent across the different Linux and UNIX operating systems flavors, as well as aligned with Windows so that you can get a consistent view across all the different operating systems in your datacenter.
Custom Monitoring
But what if you want to monitor something that is not included in the Microsoft-provided management packs? OpsMgr provides easy extensibility via templates, which are wizards in the OpsMgr console that under-the-covers create additional management packs to do your custom monitoring. Three templates are included in System Center 2012 R2 OpsMgr:
Log File monitoring: With this template, you can specify the pathname to any log file to monitor, whether produced by the operating system or an application you are running. You specify a Linux/UNIX regular expression to match. As the log file is monitoring, any line that matches the regular expression is detected and sent back to the OpsMgr management server to generate an alert.
Process monitoring: With this template, you specify the process name of a process you want to monitor for existence. This process could be a service, a daemon, or just a running program. You can also specify how many instances of the process you want to ensure are running, which is especially useful for applications that spawn multiple service processes, and you want to make sure you have a minimum number of child service processes. The OpsMgr agent sends running process information back to the OpsMgr management server, and the management server generates an alert if the process is not running, or if the minimum count requirement is not met.
Shell command line: This set of templates provides an “escape hatch” for any other monitoring you might need to do. You specify an arbitrary shell command line to run. The shell command executes, and the result is treated as a health indicator (healthy/warning/unhealthy) or as a performance value. While you are limited to a single shell command line, judicious use of semi-colons allows an almost unlimited range of things you can monitor and evaluate.
The upcoming System Center 2016 Operations Manager adds a fourth set of templates – UNIX/Linux Script – that are similar to the shell command line templates, but expanded to allow execution of arbitrary multi-line scripts. Rather than being restricted to a single shell command line, you can enter the full multi-line script into the wizard. Also, you can preface the script with the standard Linux “#!” syntax to specify a script interpreter, enabling you to use any standard type script that can be written for your favorite shell or even your favorite scripting language like Perl, Python, or PHP .
Summary
Operations Manager is great framework for monitoring a huge range of operating systems and workloads using the management pack concept. Microsoft provides management packs for Linux and UNIX operating systems, with built-in monitoring of the health and performance of all the key Linux/UNIX OS resources. This monitoring functionality parallels monitoring functionality for Windows so that you have a consistent view across all the servers in your datacenter. OpsMgr also provides easy extensibility via templates, with the ultimate escape to a shell command line or script to monitor pretty much anything. The monitoring is accomplished using an agent that has full source code availability and documentation so that you can even rebuild it yourself.
Next week I’ll continue the discussion of OS and workload monitoring for Linux and UNIX using System Center Operations Manager, but with a focus on monitoring open source middleware, including Java application servers, the Apache web server, and the MySQL database server. I’ll also touch on custom management packs that are available from 3rd parties for monitoring other workloads, such as commercial databases.