Dude! What’s flowing in my Exchange environment?
Akshay, Rafey and Lalita (a.k.a. ‘Exchange Ninjas’ ![]() ) are Premier Field Engineers from the Global Business Support - India team, who specialize in Exchange Server and allied technologies. In this collaborative work, they provide a practical and simple way of analyzing your Exchange logs.
) are Premier Field Engineers from the Global Business Support - India team, who specialize in Exchange Server and allied technologies. In this collaborative work, they provide a practical and simple way of analyzing your Exchange logs.
While interacting with our customers in field, we often find that both IT Management and Admins are looking for a simple, elegant way to report message flow statistics in their messaging environment that includes key metrics:
- Number of messages sent or received in an organization,
- NDRs generated,
- Top senders and recipients etc.
While it is true that Exchange 2007 and above does log a lot of useful information about mail flow processing in various logs like Message Tracking logs, Protocol Logs, Connectivity Logs; we have typically found that there is a perception that it is difficult to extract this kind of analytical data in Exchange, especially for those who are not PowerShell-savvy.
ExLogAnalyzer to the rescue!
While trying to address this for our customers, we have come across a very useful and simple-to-configure tool named ExLogAnalyzer. ExLogAnalyzer parses logs and triggers events based on the log entries. The best thing about this tool is that it analyzes logs across multiple servers and multiple log types in a single execution.
Please review this blog post by Victor Boctor which describes ExLogAnalyzer in some detail and also contains the download link. With that background, we will now go into specifics of how this tool can be configured and used in your environment.
Capabilities
Exchange Log Analyzer can analyze SMTP Receive logs, Connectivity Logs and Message tracking Logs. More importantly, it provides an extensibility model so that the community can develop their own analyzers, extensions (to support new log types) and analyzers (to encapsulate reporting logic).
On a side note, you probably are aware of a large number of tools which would give you detailed information from the log files. Almost all of them have this dependency of copying the logs on the machine from where we are running the tool. The best feature of ExLogAnalyzer apart from the advantages mentioned in Victor’s blog post is the capability to specify logs from multiple servers as input in a single command easily.
ExLogAnalyzer configuration file
Firstly, download the tool and extract the files from the zip file on one of the Exchange Hub Transport Servers. Many settings like the Output file location, Input logs location etc. can be configured before you run ExLogAnalyzer by configuring the ExLogAnalyzer.exe.config tool.
This is the output folder where the output csv files will be created:
<add key="OutputPath" value="c:\exlonganalyzeroutput" />
Start/End time are optional, you can specify both, one of them or none. StartTime/StartTimeUtc and EndTime/EndTimeUtc provides the flexibility of using UTC or Local time to specify the time range:
<!-- GENERAL: DATE RANGE, e.g. 2009-05-08T00:12:46.955Z –>
<add key="StartTimeUtc" value="" />
<add key="EndTimeUtc" value="" />
<add key="StartTimeLocal" value="" />
<add key="EndTimeLocal" value="" />
Note: By default all the log files in the directory are analyzed unless specific start and end times are mentioned.
As an example, here is how you specify the Input Path for Message Tracking:
<add key="MsgTrkInputPath" value="\\con-ex2010\c$\program files\microsoft\exchange server\v14\transportroles\logs\messagetracking;\\con-ex2007\c$\program files\microsoft\exchange server\transportroles\logs\messagetracking" />
Note: If we want message tracking log files of more than one Server analyzed, then separate them by semi colon as shown in the example above.
You can also control what kind of analysis you want to be done using the many Boolean parameters in the file. Most of the names are self-explanatory:
<add key="MsgTrkEventFrequencyLogAnalyzerEnabled" value="true" />
<add key="MsgTrkReceiveLogAnalyzerEnabled" value="true" />
<add key="MsgTrkTopSendersByDeliverLogAnalyzerEnabled" value="true" />
<add key="MsgTrkTopSendersBySubmitLogAnalyzerEnabled" value="true" />
<add key="MsgTrkDuplicateDeliveryLogAnalyzerEnabled" value="true" />
<add key="MsgTrkExpandLogAnalyzerEnabled" value="true" />
<add key="MsgTrkMessageSizeDistributionLogAnalyzerEnabled" value="true" />
<add key="MsgTrkRecipientNotFoundLogAnalyzerEnabled" value="true" />
<add key="MsgTrkEventTimeDistributionLogAnalyzerEnabled" value="true" />
<add key="MsgTrkTopRecipientLogAnalyzerEnabled" value="true" />
<add key="MsgTrkComponentLatencyPercentileLogAnalyzerEnabled" value="true" />
<add key="MsgTrkComponentLatencyPercentileLogAnalyzerPercentiles" value="10,20,50,80,90" />
<add key="MsgTrkComponentLatencyPercentileLogAnalyzerTimes" value="1,2,5,8,9" />
<add key="MsgTrkMailflowVisualizerLogAnalyzerEnabled" value="true" / >
You can control analysis of SMTP and Connectivity Logs accordingly by modifying the parameters in the relevant sections of exloganalyzer.exe.config file.
Now when you have configured as per need, go to the folder where ExLogAnalyzer.exe is extracted from command prompt or Powershell and run ExLogAnalyzer.exe. After the tool is run, go to the output folder you had specified to retrieve the output files.
Sample Output
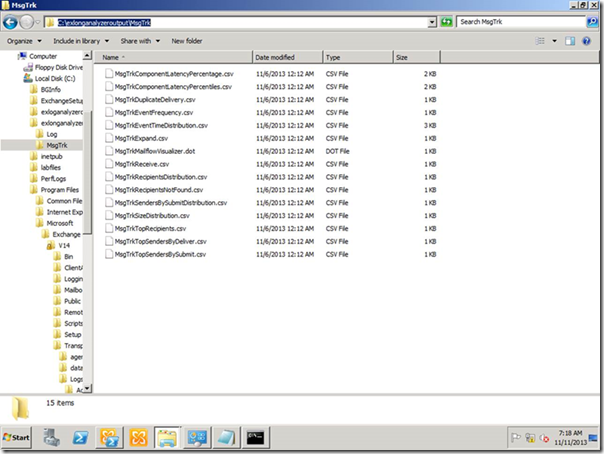
Below is the screenshot of the Output folder in a lab setup (please click on the image for a larger image)
As you can see, the tool provides outputs in the CSV format - copy the output folder to a machine which has Excel installed to use them for further analysis. As an example, following is a screenshot of a sample MsgTrkTopSendersbySubmit file:
Hope this helps out any admins or IT managers out there in getting message flow intelligence data that they require.
Original content from Lalita Jat, Akshay Katti & Mohammed Abdul Rafey. Posted by MSPFE editor Arvind Shyamsundar.

