Heartbeat Metric Alerts for Log Analytics
At some point, if you have configured alerts within OMS, you probably have struggled with missing, delayed or false heartbeat alerts. We are aware of these issues and on most of the cases, it was related with latency - for further details on ingestion delays and how it affects the alert configuration refer to this link . Having heard the feedback and in our process of constant improvement, we are introducing a preview of a new alerting feature within Azure Monitor (present in the Azure Portal).
With this new solution, we will able to retrieve near real-time notifications of a machine's heartbeat (as well as other metric related alerts), connected to Log Analytics. Let me share with you some clarity on the configuration of this feature:
Azure Monitor - Heartbeat Alerts (OMS)
Now for the new feauture - the near real-time alerting (currently in limited public preview):
This brings down the time it takes to generate a log alert to under 5 minutes. The Metric Alerts on Logs, currently supports the following log types on OMS Log Analytics - heartbeat, perf counters (including those from SCOM), and update.
With this solution, logs are converted to metrics as they stream into Log Analytics, these metrics are then pumped into the metrics platform where they can be alerted on. This metric conversion, avoids the ingestion of logs and a bypass is possible, avoiding the described ingestion delays.
Alerting configuration with the goal of validating machine hearbeat can now be configured, and a more reliable and consistent monitorization can be achieved by this
The official article with the launch is here: https://azure.microsoft.com/en-us/blog/faster-metric-alerts-for-logs-now-in-limited-public-preview/
Configure Alerts
Before starting the configuration, you will need to sign up for the this feature: https://aka.ms/MetricLogPreview
Afterwards you should be receiving a PDF with the additional details that you need to proceed on doing to gain access to it.
After performing the above, here's the configuration needed:
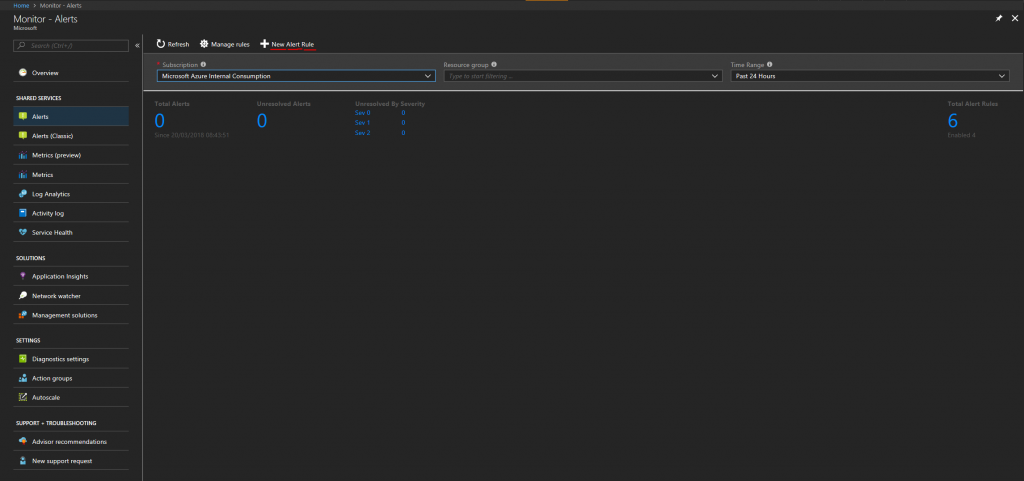
1 - Head to the Azure Portal and find "Monitor"

2 - Then to "Alerts" and select "New Alert Rule"
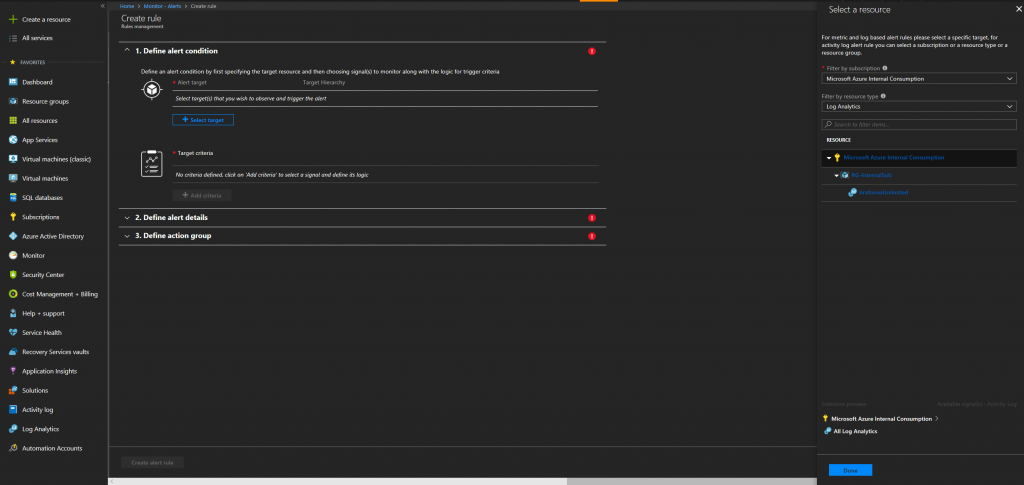
3 - Now, start adding the configurations for the alert, let's begin with the target selection - Select your target - Subscription, Resource Group and OMS workspace:
 4
4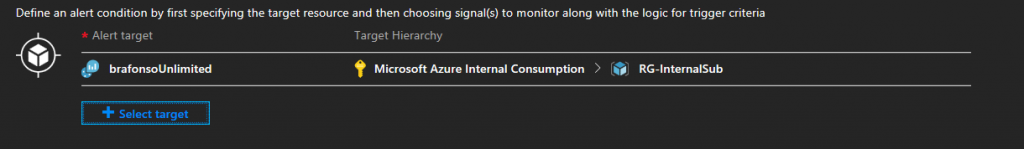
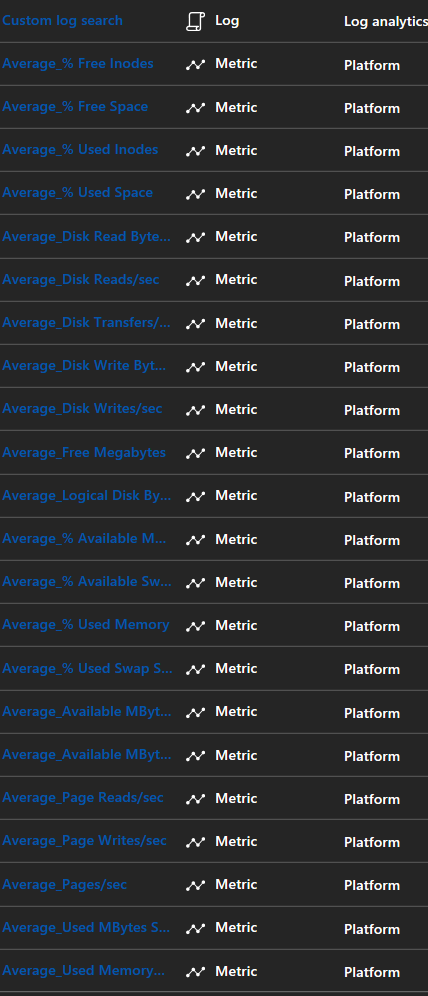
4 - Add a criteria - as soon as you select this option, you shall be present with all the available options including the metrics:
5 - For the purpose of this test, we will configure Heartbeat metric, after selecting it, you should be seeing something similar to this:
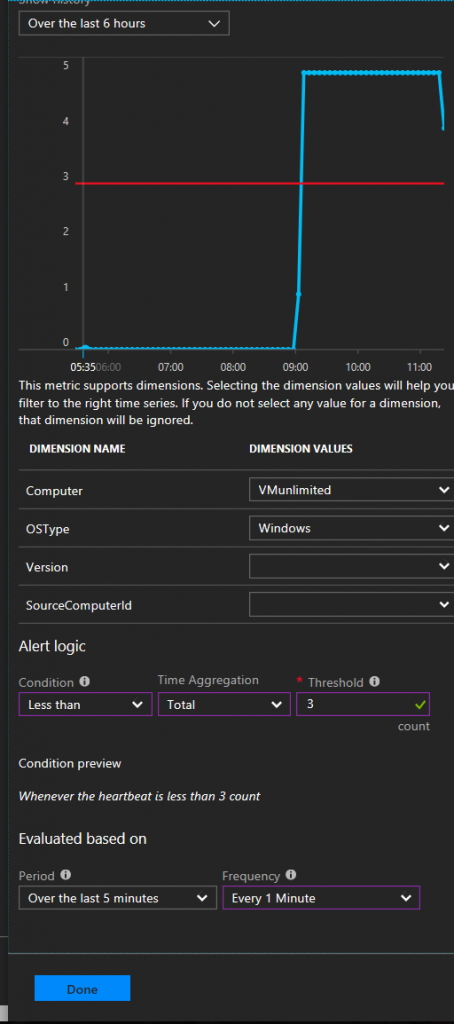
6 - You can configure the alert for your needs, by selecting the specific virtual machine, its OS, version, etc.
Also, configure the condition you wish to apply (in the example above, we have an alert for when the heartbeat is less than 3, to be checked over the period of the last 5 minutes, and with a frequency of 1 minute)
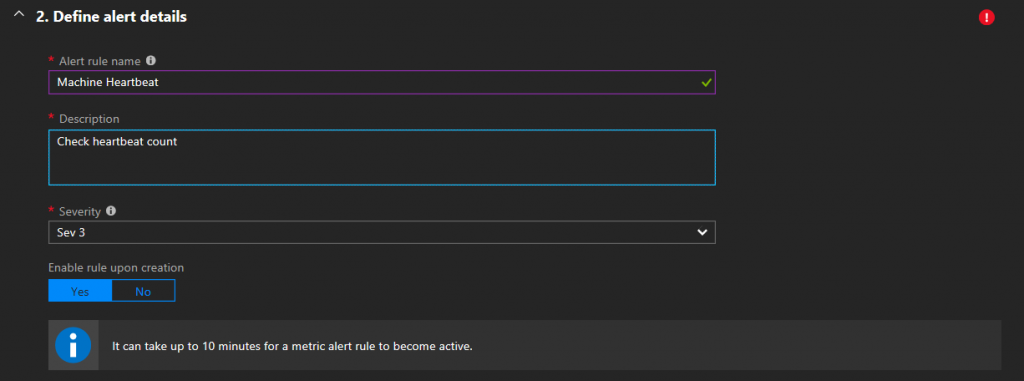
7 - Insert a name, description and severity for the alert, and check if you wish for it to become instantly enabled after creation:
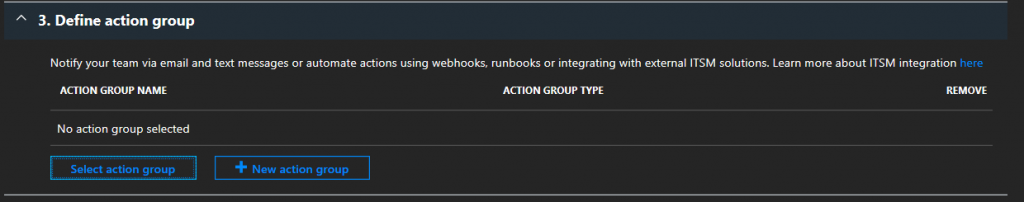
8 - As final configuration, you need to define the action group, in order to notify specific individuals or teams, within a variety of channels (email, sms, runbooks, integration with third party ticketing software, etc):
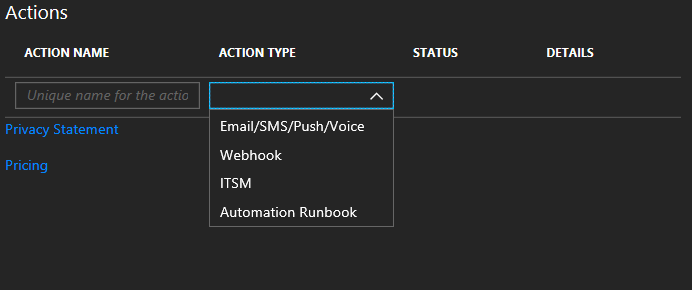
You can create a new action group and select the method of your preference:
You are all set! From the moment you configure your alert you can manage it under Alerts in Manage Rules. You can delete, desable or enable your rules from there:

All of this process will provide a more closer experience to real-time monitorization, since the SLA's are incredibly low.
Feel free to reach out to me or my team, for further assistance on this.
Bruno Afonso - Microsoft Support Engineer in Azure Monitoring and Automation