WMI: How to Troubleshoot WMI High Handle Count
Scenario
Windows Management Instrumentation Service (Winmgmt) or WMI provider (wmiprvse.exe) is experiencing high handle count
Your first thing to do is check the Application Event log for following event:
Source: Microsoft-Windows-WMI
Event 5612 Wmiprvse.exe exceeding handle quota limit Event
WMI has stopped WMIPRVSE.EXE because a quota reached a warning value. Quota: %1 Value: %2 Maximum value: %3 WMIPRVSE PID: %4
If you find the above Event, you can try and bump up the handle quota limit to see if it resolves your issue. If it is a leak, then bumping limit will only mean it will take longer to reach the new limit. If it’s just load related, then bumping the limit could resolve the issue.
The event will tell you what the handle count was, and if it is higher than the 8192 value I suggest below. You can then skip this section and move on to data collection to figure out the cause of high handle count.
How to increase the handle quota limit for the WMI Provider Service
- Go to Start--> run and type wbemtest.exe
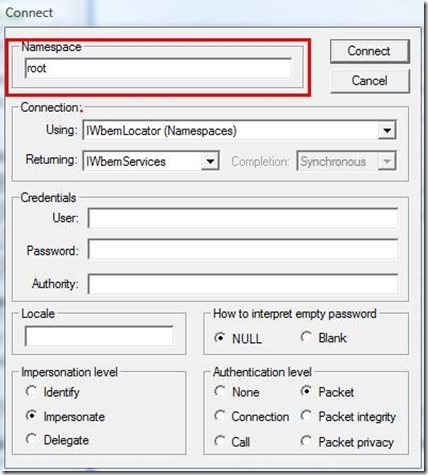
- Click Connect on the Windows Management Instrumentation Tester
- In the namespace text box just enter "root" (without quotes)
- Click Connect
Note: you aren’t connecting to CimV2 or any other namespaces. It’s ROOT
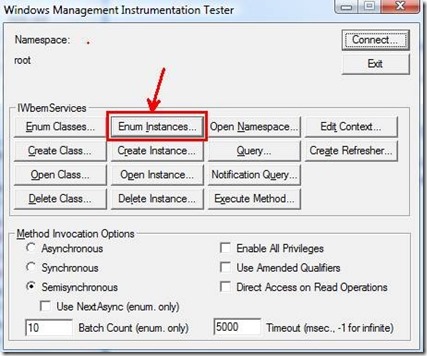
- Click "Enum Instances…"
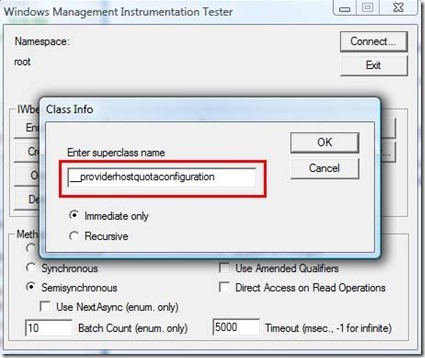
- In the Class Info dialog box enter Superclass Name as "__ProviderHostQuotaConfiguration" (without quotes) and press OK.
Note: a double underscore __ precedes ProviderHostQuotaConfiguration
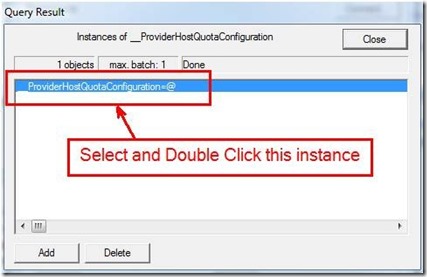
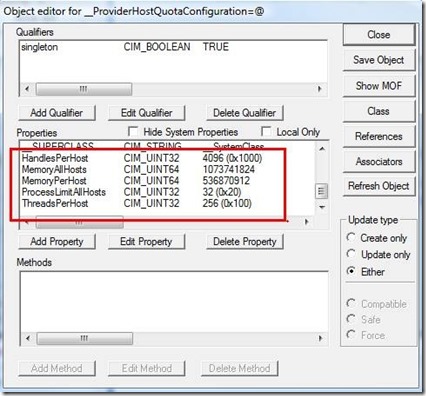
- A query Result window will come up. In this windows now double click "__ProviderHostQuotaConfiguration=@"
- An Object Editor windows will come up now
- Under properties find the property "HandlesPerHost"
- Change the value from default of 4096 to 8192
- Click Save Property
- Click Save Object in the Object Editor window
- Close the other windows now and exit WMI Tester
- Restart Windows Management Instrumentation Service.
If after bumping up quota limit and wmiprvse still exceeding quota limit, accomplish following actions below. You will want to read through the rest in its entirety to ensure you get all of the necessary tools downloaded before taking any actions.
Configure System for Complete Memory Dump by referring to:
Windows 8 and Windows Server 2012 Automatic Memory Dump: https://blogs.technet.com/b/askcore/archive/2012/09/12/windows-8-and-windows-server-2012-automatic-memory-dump.aspx
Windows does not create a memory dump file when a Stop error occurs in Windows 8 or Windows Server 2012: https://support.microsoft.com/kb/2853466
Windows 2008, Windows Vista, Windows 7, Windows 2008 R2: https://support.microsoft.com/kb/969028
Windows Server 2003 and Windows XP: https://support.microsoft.com/kb/972110
Collect perfmon logging using logman method
Directions below will create 2 perfmon logs, one at a 5 minute interval (PerfLog-Long) and a short 5 second interval log (PerfLog-Short) and they will be placed in C:\Perflogs folder.
- Long log (5 min intervals) – no thread counter, 250 MB:
1. Click on Start
<<Start Search>>, enter "CMD.exe" w/o the quotation marks and then press Enter.
2. Copy and paste the following command into the command prompt window:
Logman.exe create counter PerfLog-Long -o "c:\perflogs\PerfLog-Long.blg" -f bincirc -v mmddhhmm -max 250 -c "\Cache\*" "\LogicalDisk(*)\*" "\Memory\*" "\Network Interface(*)\*" "\Paging File(*)\*" "\PhysicalDisk(*)\*" "\Processor(*)\*" "\Process(*)\*" "\Redirector\*" "\Server\*" "\Server Work Queues\*" "\System\*" -si 00:05:00
3. Start the log with:
Logman.exe start PerfLog-Long
4. Please stop the performance log as soon as the issue returns with the following command:
Logman.exe stop PerfLog-Long
- Short, high resolution log – 5 sec interval with thread counter, 250MB
1. Click on Start
<<Start Search>>, enter "CMD.exe" w/o the quotation marks and then press Enter.
2. Copy and paste the following command into the command prompt window:
Logman.exe create counter PerfLog-Short -o "c:\perflogs\PerfLog-Short" -f bincirc -v mmddhhmm -max 250 -c "\Cache\*" "\LogicalDisk(*)\*" "\Memory\*" "\Network Interface(*)\*" "\Paging File(*)\*" "\PhysicalDisk(*)\*" "\Processor(*)\*" "\Process(*)\*" "\Redirector\*" "\Server\*" "\System\*" "\Server Work Queues\*" "\Thread(*)\*" -si 00:00:05
3. Start the log with:
Logman.exe start PerfLog-Short
4. Please stop the performance log as soon as the issue returns with the following command:
Logman.exe stop PerfLog-Short
Please note that if you reboot the server, you will need to start the logs again as they will not automatically restart on boot.
Configure Handle Tracing
-
- Download Windows Debugging Tools for Windows from following link: https://msdn.microsoft.com/en-us/windows/hh852365.aspx
You probably just need the standalone version since we only need the debugging tool and not the whole WDK package.
-
- Go to the directory where you installed the tool and you will find gflags.exe as one of the files, right click on it and select run as administrator
- Click on the ‘Kernel Flags’ tab
- Check the box next to ‘Enable bad handles detection’
- Click on the ‘Image File’ tab
- Next to ‘Image: (TAB to refresh)’, enter wmiprvse.exe or if tracing WMI Service enter the unique name given to the svchost process for WMI Service per directions in next section below
- And then click on the ‘Tab’ key
- Next to ‘Stack Backtrace: (Megs):’ enter ‘10’
- Click on Apply
- Click on Ok
- Restart WMI service
If it is a svchost process showing high handle count, you can use Task Manager and add PID column, then identify which svchost process has the high memory usage. From there in a command prompt you can run tasklist /svc and look for the PID then identify if a single service is running in that svchost process or multiple services. If multiple services, it may become necessary to break each service out to run in its own svchost process to determine if it is the WMI service (winmgmt) that is causing the issue. From experience it will be the WMI service more times than not but not always, as such I would try to break it out first on its own and monitor to see if it is the one driving up high handle count in the shared svchost process.
WMI (Windows Management Instrumentation) service, you can break it out by accomplishing the following.
Break WMI Service out into its own unique svchost process
a. Open command prompt with elevated privileges
b. Run following command: sc config winmgmt type= own
c. Restart Wmi service
d. Run sc query winmgmt to ensure status of service now reflects “own” indicating running in its own svchost process
When issue had been resolved or no longer needing the service broken out into its own svchost process, place it back into the shared svchost process by running following command from command prompt:
sc config <service name> type= share
e. Restart the service or machine and verify result is Win32_SHARE_PROCESS when you run sc query winmgmt command again
f. Change command focus to system32 folder and run following command: copy svchost.exe wmisvchost.exe
g. From start run type in regedit and navigate to HKLM\System_CurrentControlSet\Services\Winmgmt
h. Modify existing ImagePath from %systemroot%\system32\svchost.exe -k netsvcs to %systemroot%\system32\wmisvchost.exe -k netsvcs
I. Restart wmi service with net stop winmgmt and net start winmgmt commands again
j. Verify you now see wmisvchost.exe process running by running tasklist or looking in task manager at process list
k. You would now substitute wmisvchost.exe in lieu of wmiprvse.exe in step 6. under Configure Handle Tracing above
Using debugger to attach to the process in windbg.exe and running !htrace –enable command
1. Launch WinDbg program from under Debugging Tools for Windows that you installed earlier.
2. Created folder c:\websymbols
3. Click on File-Symbol path and add the following symbol path to the debugger: SRV*c:\websymbols*https://msdl.microsoft.com/download/symbols
4. Click on File-Save Workspace
Attach to process to accomplish handle tracking using htrace
To do this:
1. From Windbg - File - Attach a Process - Select the instance of wmiprvse.exe with high handle count
Note: If it is WMI Service (run tasklist /svc or Task Manager with PID column added first to find the PID of svchost.exe containing winmgmt which you should have broken out and uniquely named wmisvchost.exe per earlier directions)
2. Run following command from the debugger:
.logopen "C:\debug.log" then hit <ENTER> key
!htrace -enable 0x20000 then hit <ENTER> key
Note: By default, Windows Vista, Windows Server 2008, Windows 7 and Windows Server 2008 R2 keep a history of 4000 handles open and close operations.
With !htrace you can enable to keep a much higher history by doing the following:
!htrace -enable 0x20000
In this example, we are increasing the handle history to 131072 (decimal, 0x20000 hexadecimal)
!htrace –snapshot then hit <ENTER> key
g then hit <ENTER> key
3. Now, let the process run until the number of handle has increased a lot and gotten high.
Final htrace log
1. Break into debugger with Keyboard keys (Ctrl+Break)
2. Run following commands:
!htrace –diff then hit <ENTER> key
.logclose then hit <ENTER> key
.detach then hit <ENTER> key
3. Close WinDbg
Now complete the following actions once you have gotten your final htrace log
1. If high handle count is with wmiprvse, download the latest version of the Windows Sysinternals tool Process Explorer. https://technet.microsoft.com/en-us/sysinternals/bb896653.aspx
2. Find the instance of wmiprvse.exe with high handle count and right click on it and bring up the properties sheet. Click on the WMI Providers tab and document the listed providers
3. If the WMI Service was the process with the high handle count, then dump out the WMI service process which should be wmisvchost.exe per previous directions and all instances of wmiprvse.exe using procdump. If it is wmiprvse.exe that is exhibiting the high handle count, then only need to dump out that instance and nothing else.
a. Download Windows Sysinternals tool called Procdump from URL: https://technet.microsoft.com/en-us/sysinternals/dd996900.aspx
b. Open a command prompt with elevated or administrative rights and change to the directory were you saved Procdump
c. Open Task Manager and add the PID column view then go locate the instance of wmiprvse.exe with high memory usage and note the PID
d. Run the following command: procdump –ma <PID>
e. Note: Replace <PID> with actual PID you documented for instances of wmiprvse.exe and/or wmisvchost.exe as it applies based on directions above
4. Stop Perfmon logging
5. Do a complete memory dump of the machine
At this point with data in hand you will want to open a Support Incident with Microsoft to get the data analyzed to help determine cause of high handle count.
Reference this blog when you open the Support Incident Case with Microsoft as it will help the engineer understand what actions have been taken or followed and will help us track the effectiveness of the blog.
