WMI: How to troubleshoot High CPU Usage by WMI Components
Scenario
Windows Management Instrumentation Service (Winmgmt) or WMI provider (wmiprvse.exe) is consuming high amounts of CPU.
In the directions below, you may have already broken out WMI Service to troubleshoot your issue. By default, WMI runs in the main shared networking svchost process with several other services.
If it is a svchost process showing high cpu usage, you can use Task Manager and add PID column, then identify which svchost process has the high memory usage. From inside a command prompt you can type in tasklist /svc and look for the PID #, and identify if a single service is running in that svchost process or multiple services. If multiple services, it may become necessary to break each service out to run in its own svchost process to determine if it is the WMI service (winmgmt) that is causing the issue. From my experience, it will be the WMI service more times than not but not always. As such, I would suggest breaking it out first into its own, and monitor to see if it is the one driving up high memory usage in the shared svchost process.
If you suspect the WMI (Windows Management Instrumentation) service, you can break it out following directions below.
Break WMI Service out into its own svchost process
- Open command prompt with elevated privileges
- Run following command: sc config winmgmt type= own
- Restart Wmi service
- Run sc query winmgmt to ensure status of service now reflects “own” indicating running in its own svchost process
When issue had been resolved or no longer needing the service broken out into its own svchost process, place it back into the shared svchost process by running following command from command prompt:
- sc config <service name> type= share
- Restart the service or machine and verify result is Win32_SHARE_PROCESS when you
- run sc query winmgmt command again
Configure Perfmon Collection using logman.exe method. Capture 15 minutes while issue is occurring.
Short, high resolution log – 1 sec interval with thread counter, 250MB
1. Click on Start
<<Start Search>>, enter "CMD.exe" w/o the quotation marks and then press Enter.
2. Copy and paste the following command into the command prompt window (if this does not work, you may need to manually type it in):
Logman.exe create counter PerfLog-Short -o "c:\perflogs\PerfLog-Short" -f bincirc -v mmddhhmm -max 250 -c "\Cache\*" "\LogicalDisk(*)\*" "\Memory\*" "\Network Interface(*)\*" "\Paging File(*)\*" "\PhysicalDisk(*)\*" "\Processor(*)\*" "\Process(*)\*" "\Redirector\*" "\Server\*" "\System\*" "\Server Work Queues\*" "\Thread(*)\*" -si 00:00:01
3. Start the log with:
Logman.exe start PerfLog-Short
4. Please stop the performance log as soon as the issue returns with the following command:
Logman.exe stop PerfLog-Short
Please note that if you reboot the server, you will need to start the logs again as they will not automatically restart on boot.
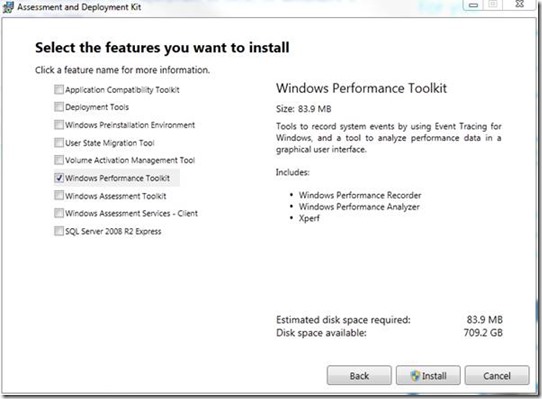
Collect and Xperf trace for High CPU by using the Windows Performance Recorder form the Windows Performance Toolkit which you can install from the ADK
Note: If the Operating System is a 64 bit box, you must first accomplish the following registry setting before collecting Xperf trace.
Registry Path
HKLM\System\CurrentControlSet\Control\Session Manager\Memory Management
Setting
DisablePagingExecutive
Data Type:
REG_DWORD
Value:
1
NOTE setting this key is not needed on Windows Server 2012 & 2012 R2
Reboot machine to place registry setting into effect.
- Download the Windows 8 ADK (Windows Assessment Deployment Kit) from here.
- Open the adksetup.exe and hit next until you get you the option to select feature options
- Select "Windows Performance Toolkit" and hit "Install"
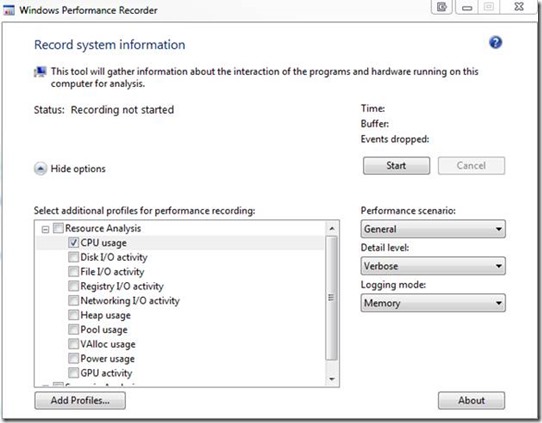
After installation has finished, start creating a trace by starting the "Windows Performance Recorder"
Select CPU usage under Resource Analysis
Logging mode can be left set to “Memory”, or you can change to “File”. Just be conscious of your disk space if you chose “File” as the etl file can become large fast
Capture high cpu occurrence, but do not let the recording run for no more than 10 minutes.
Immediately after capturing the event using Windows Performance Recorder (WPR), now use process explorer to dump out the process exhibiting high cpu usage.
1. Download Windows Sysinternals tool called Procdump: https://technet.microsoft.com/en-us/sysinternals/dd996900.aspx
2. Open a command prompt with elevated or administrative rights and change to the directory were you saved Procdump
3. Open Task Manager and add the PID column view, then go locate the instance of wmiprvse.exe with high cpu usage and note the PID. If it was the WMI service that had the high cpu, then you should already have it broken out to run in its own svchost process and note the PID of that svchost process. To confirm you have the right svchost process, you can run tasklist /svc from administrative command prompt and verify the PID noted in task manager and ensure it is the svchost process running winmgmt in it.
4. Run the following command: procdump –ma -s 60 -n 3 <PID>
Note: Replace <PID> with actual PID you documented for instance of wmiprvse.exe or for the svchost process running winmgmt exhibiting high memory usage
The above command will produce 3 dumps spaced 1 minute apart each in same directory you ran the procdump command from
5. Download the latest version of the Windows Sysinternals tool Process Explorer. https://technet.microsoft.com/en-us/sysinternals/bb896653.aspx
6. If it was wmiprvse.exe that had the high CPU usage, then find the instance and right click on it and bring up the properties sheet. Click on the WMI Providers tab and document the listed providers
At this point you will now need to open a Support Incident Case with Microsoft to get the data analyzed to determine cause of high CPU usage.
Reference this blog when you open the Support Incident Case with Microsoft as it will help the engineer understand what actions have been taken or followed and will help us track the effectiveness of the blog.
Next up: WMI: How to Troubleshoot WMI High Handle Count

