Creating a Business Intelligence framework for data collected by OpsMgr 2007
Source: Operations Manager Product Team Blog
Yesterday the PerformancePoint team released a sample solution that shows how to build cubes from the Operations Manager DW and then build balanced IT scorecards using Office PerformancePoint server from these cubes.
Product Requirements:
- Microsoft SQL Server 2005 (database engine, Analysis Services, Integration Services) – system requirements here
- Office SharePoint Server 2007 – system requirements here
- OR Windows SharePoint Services 3.0 SP1 – system requirements here
- Windows SharePoint Services 3.0 SP1) Office PerformancePoint Server 2007 – system requirements here
- System Center Operations Manager 2007 – system requirements here
- Windows Server® 2003
Components of the framework, and the flow of data from source data to the finished dashboards:
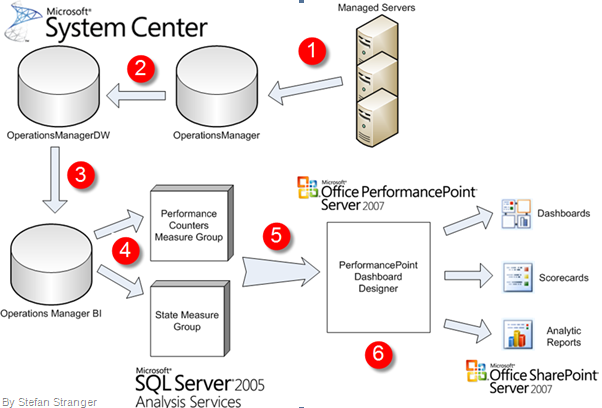
- System Center Operations Manager managed servers collect monitor state and performance counter data saved in the Operations Manager operational database.
- The Operations Manager data warehouse (OperationsManagerDW) collects data from the operational database. Data is pre-aggregated and stored in tables architected to support production reporting requirements.
Steps one and two are out-of-the box processes for Operations Manager. The Business Intelligence framework begins with the following step, the population of a new Business Intelligence database. - Collect the Source Data - A small subset of data in the Operations Manager data warehouse is transformed and loaded into the Business Intelligence framework database (OperationsManagerBusiness Intelligence). This database contains the star schemas for the Analysis Services OLAP cubes.
- Build OLAP Cubes - Analysis Services OLAP cubes are built and processed from data stored in the OperationsManagerBI database.
- Put it All Together - Create Office PerformancePoint Server 2007 Dashboards, Scorecards, and Analytic Reports - Data from the OLAP cubes is used to populate PerformancePoint Server scorecards, dashboards, and analytic reports. These components are originally created using the Office PerformancePoint Server 2007 Dashboard Designer.
- Deploy Dashboards, Scorecards, and Analytic Reports in SharePoint - Scorecards, dashboards, and analytic reports are made available to the user community through SharePoint Server. Once the scorecards, dashboards, and analytic reports are initially created and deployed, they should not need to be deployed again – these components will be refreshed as new data becomes available in the OLAP cubes.
The solution can be found on www.microsoft.com/BI and www.microsoft.com/PerformancePoint