Did you know , Dead locks can be track from the System Health in SQL 2012
Before using SQL server 2008, in order to capture a deadlock, we had to create a server side/profiler trace or use trace flags 1204, 1222.
If you were lucky enough to work with SQL 2008/2008R2 you could have tried using XEvents (which were introduced in SQL 2008).
SQL Server 2012 added a new feature, System Health (SH). The System Health is the new default trace that we are familiar with, from the old days of SQL Server.
I have previously written about the SH ( System Health ).The most interesting addition regarding this post, is the automatic capture of deadlocks.
The deadlock can be seen in 2 ways:
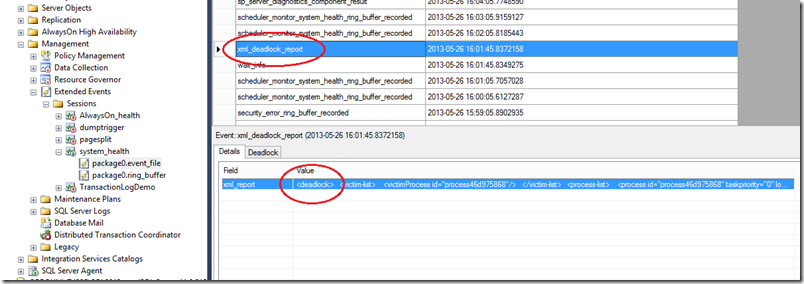
1) On the XEvent monitor under the system_health monitor:
2) With a T-SQL query that connects to the System Health collector file:
 SELECT    xed.value('@timestamp', 'datetime') as Creation_Date,
         xed.query('.') AS Extend_Event
 FROM    (    SELECT    CAST([target_data] AS XML) AS Target_Data
             FROM    sys.dm_xe_session_targets AS xt
                     INNER JOIN sys.dm_xe_sessions AS xs
                     ON xs.address = xt.event_session_address
             WHERE    xs.name = N'system_health'
                     AND xt.target_name = N'ring_buffer')
 AS XML_Data
 CROSS APPLY Target_Data.nodes('RingBufferTarget/event[@name="xml_deadlock_report"]') AS XEventData(xed)
 ORDER BY Creation_Date DESC
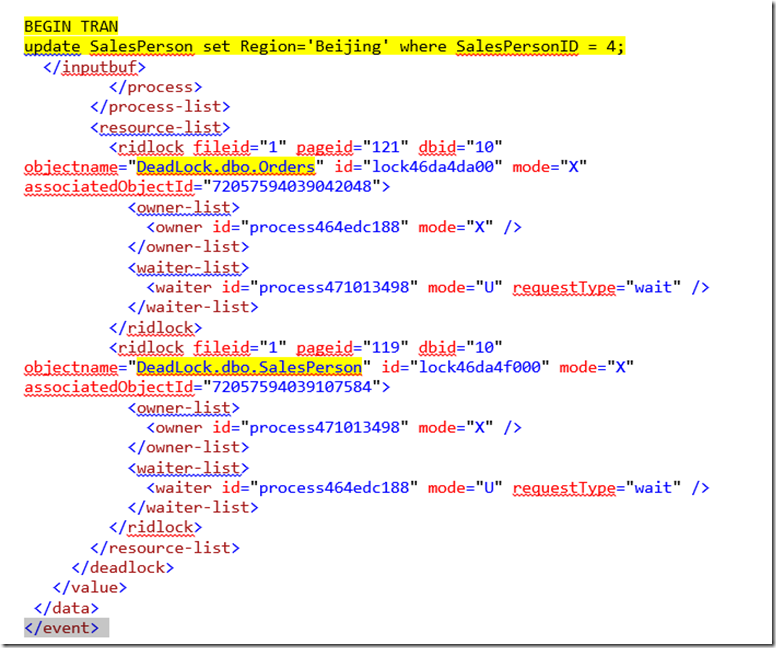
By clicking on the Extend_Event XML filed, we would get the XML file showing all the information about the transaction marked in yellow.
As I said before, System Health is a great tool for the XEvent. You’ll find there a lot of interesting information about your system.


