PERFMON & SQL Server - a small useful tip
One of the best Performance tools that I use is the PERFMON.
PERFMON is a tool that exists out of the box on every windows machine and has lots of counters for almost every application. Perfmon provides current, accurate information on thousands of different attributes of your system.
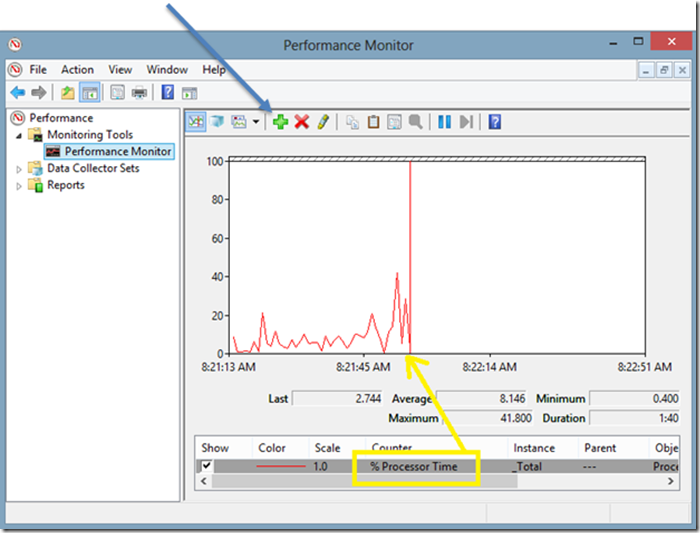
If you open the PERFMON in windows [using the PERFMON key word in the run command line] the tool will open and will show the default counter %Processor time.
By clicking on the green + sign one can add new counters such as SQL, network, disk and other counters.
Now imagine you are in a middle of a performance crisis and we need to add the SQL counters.
Basically, this might take some time. In windows 2008, Vista and above it doesn't have to be song long; we can create customized template (configfile) of performance counters and launch it immediately.
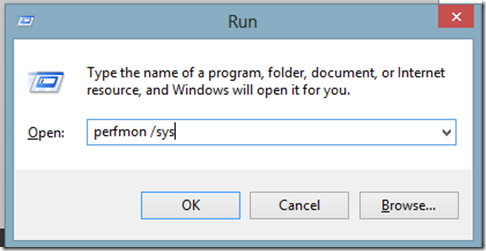
To do so we need to run the perfmon in sys mode:
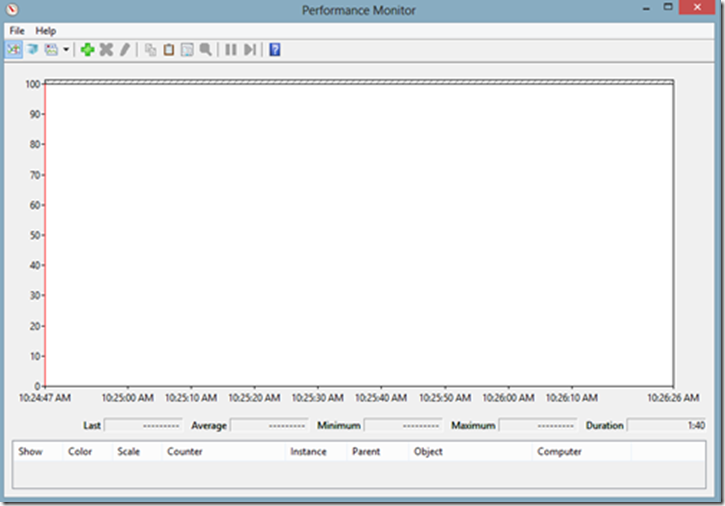
Doing so, will open the app in sys mode and in this screenshot we can add the counters we’d like to see every time we are facing a performance issue and we need to launch the perfmon rather quickly.
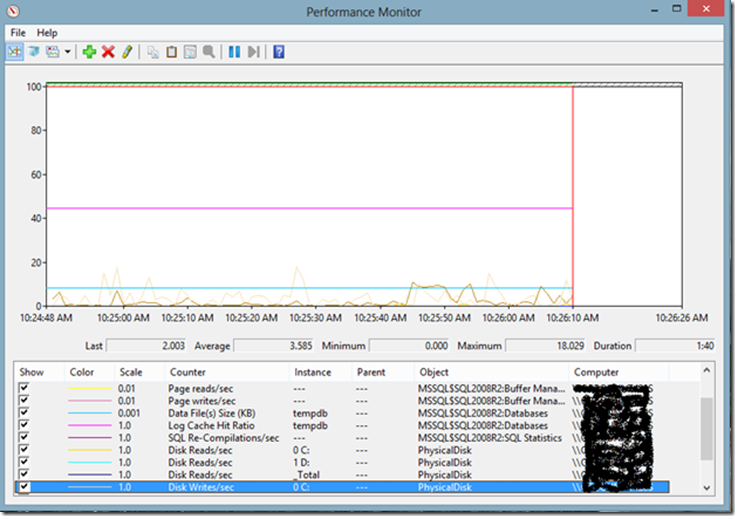
The perfmon is up and running with the new counters already, we can show it in the line format as seen here or in report / histogram format.
After that we need to click the file menu and save the perfmon file on the desktop or in a known folder.
The file will be save in the format of Performance Monitor Configuration [File_Name.PerfmonCfg]
The icon on the desktop will look like that
Now we can create some perfmon templates and launch it immediately with no need to preconfigure.


