Big Data in my little head
I recently attended internal training on Microsoft Big Data presented by our partner in this space Horton Works. It was a bit of a learning curve as the world of Big Data is a paradigm shift to the relational world, or so I thought. It turns out it isn't that remarkably different. The Horton Works guys did a fantastic job of walking us through the Apache Hadoop world and talking about the various components. I would definitely recommend attending one of there courses through Horton Works University.
So you maybe asking what did I learn? and more importantly how can you start exploring the world of Big Data/Hadoop and what are some practical scenario.
Lets start with the main question first of what is Big Data?
To most Big Data is about the size of the data and is it TB or PB of data, however this is not the only thing we should be looking at. The volume of data is one aspect however it is commonly summarized as the 3Vs of data as follows:
1) Volume –typically thought of in the range of Petabytes and Exabyte's, however this is not necessarily the case it could be GBs or even TBs of data which happens to be semi/multi structured.
2) Variety –Any type of data
3) Velocity –Speed at which it is collected
There are many different technological approaches to help organizations deal with Big Data. Like the days of Beta vs. VHS for the video tape world or Blu Ray vs HD DVD, they help achieve the same outcome however with different technological implementations. So like in the case of Blu Ray vs HD DVD, Blu Ray won, similarly the industry sees the Apache Hadoop technology as the industry standard for Big Data solutions. Hence, Microsoft have also adopted it and partnering very heavily for implementing Hadoop on both Windows Server (on premise) and Windows Azure (public cloud). This is despite Microsoft having various technological implementations of Big Data solutions such as what we run for Bing.com and our High Performance Computing group working on LINQ for Dryad.
So what is Hadoop?
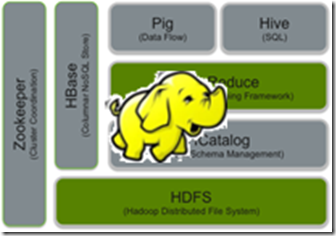
Basically Hadoop is the open source platform that enables you to store and work with Big Data. It was started by Google/Yahoo and now maintained as open source project with Horton Works being one of the leading contributors to the project. The main components of it are :
- HDFS – Highly Distributed File System that enables you to chunk up the large volumes of data across many compute nodes – 1000s of nodes in a cluster
- Map Reduce – the querying framework that enables you to breakup the query tasks (Java programs) across the many HDFS nodes.
As you will see from the diagram below there are many different components that work along side the above core components. The main ones we will explore in this blog post are:
- Pig – is a high-level data-flow language and execution framework. It is a abstraction layer on top of Map Reduce that will eventually run parallel jobs. Pig is good for taking lots of data and running it for long time, it is good for conducting ETL, data modeling. Pig script is called Pig Latin.
- Hive – is a data warehouse infrastructure that provides data summarization and ad hoc querying. Hive provides a SQL like querying capability and it is called HiveQL. You can start applying the SELECT * FROM <tablename> constructs on the data residing on HDFS.
Where does Microsoft fit into this picture?
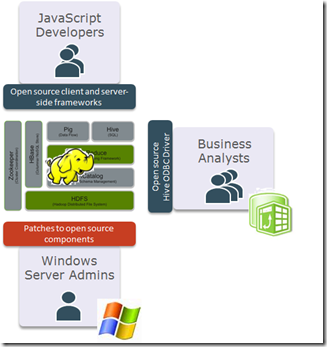
From the above diagram you can see that there are 3 main areas where Microsoft is extending/contributing to the Apache Hadoop project. They are as follows:
- Hadoop on Windows Server/Azure – the first is to get Hadoop to work on the Windows platform both on premise and in the public cloud. This is natively without any emulation layer. The reason to have it run on Windows is more so to do with the easier management of the infrastructure. However in our testing we have seen some performance gains on the Windows platform over others.
Having Hadoop run on Windows means that it can easily managed as the rest of your existing Windows based infrastructure through management tools like System Center, integration with Active Directory for security and single sign-on. Having it run on the cloud means you don't have to manage this infrastructure at all you can just start using the power of it for your data analysis and all the provision and management is taken care of for you.
- Easier access to Hadoop platform for developers – enabling JavasScript for easier programmability against the Hadoop platform instead of just Java Map Reduce programs. In addition to JavaScript Microsoft will also add.NET integration to improve developer productivity against the Hadoop platform. Bi-directional SQQP connectors are also being developed to connect SQL Server &/or Parallel Data Warehouse appliances to Hadoop.
- Access through familiar tools for analysts - through the work on the ODBC Hive Driver and direct connectivity from Excel & PowerPivot in Excel, provides users with an already familiar tool to access data that is stored in the Hadoop infrastructure and mash it up with structured data to derive insights easily.
In addition to the above direct technological investments, one of the other major areas Microsoft is adding value is in the space of data enrichment to make it easier for you to create insights and make decisions. This is through connecting data whether it be residing in Hadoop or structured world (RDBMS) services such as those being made available in Excel 2013 that will suggest other data sets that will enrich your internal data such as address data, demographic data, etc.
Is there use for Hadoop in my Enterprise?
As the Apache Hadoop project is open source based and came out of Web 2.0/startup companies, this question of suitability for enterprise does arise. With the Microsoft and Horton Works partnership, questions around supportability and stability of open source projects should no longer be a issue, you should instead think of scenarios to utilize these technologies to give your business a competitive advantage.
Analysing your organizations structured and multi-structured data can help you with creating differentiation - create new offers, better manage marketing campaigns leading to reduced waste and improved retunes. Keep your customers longer – remember acquiring costs of customers are higher than retention costs. It is analytics that can assist in transforming your business – the rest of the technologies in IT are just about making it more efficient to run. Below is a table outlining some scenarios on how you can utilize Big Data across different industries.
| Industry/Vertical | Scenario |
| Financial Services |
|
Web & E-tailing |
|
| Retail |
|
| Telecommunications |
|
| Government |
|
| General (cross vertical) |
|
Hadoop really shouldn't be put in the too hard basket, it is like using any other data platform product. The mind shift difference is that instead of modeling the data up front, you are able to ingest data in its raw format in HDFS and then run Map Reduce jobs over it. The iterations will now take place with your Map Reduce jobs instead of in the ETL/data model design. This flexibility makes it easier to work with large multi structured data.
Enough Blurb lets get our hands dirty!!!
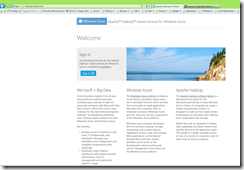
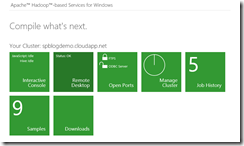
Go to https://www.hadooponazure.com/ and sign up for access to the free preview of the Hadoop on Windows Azure. All you need is a Microsoft Account (formerly Live, Hotmail accounts).
In this blog post I showcase how the sample Hello World equivalent program in Hadoop – Word Count – can be leveraged to profile/segment customers. In my below example I take a look at banking transactions over 5 years to see if we can profile the customer.
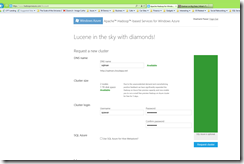
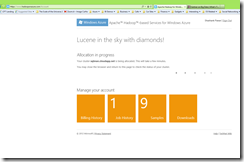
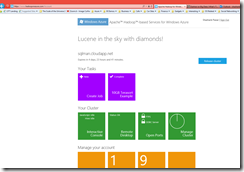
1) Sign in and Request a Cluster
About 10 minutes later the cluster is created and deployed with all the right software. This automated deployment is doing quite a lot in the background, as the Apache Hadoop project is open source, there are many forks in the development and many versions. The Microsoft and Horton Works partnership ensures and tests the appropriate combinations (of versions) of the different components such as the HDFS version that is most compatible with HIVE, Pig versions, etc.
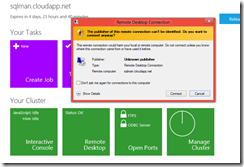
2) Remote Desktop to the head node of the Hadoop cluster
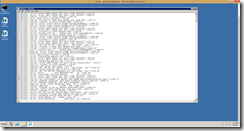
3) View the financial transactions
4) For this demo we will use the Word Count Map Reduce Java code, I have made this available at the following location - WordCount.java - https://sdrv.ms/PdsFP7. It is also available in the Samples once you login to your cluster.
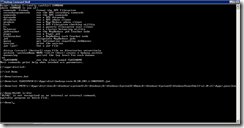
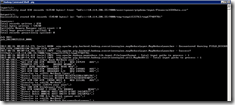
a) Open Hadoop command prompt and set Environment paths
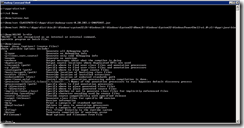
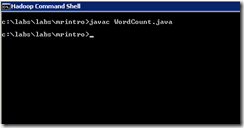
b) Test it out by invoking javac compiler
c) Create a directory to upload the financial transactions files into HDFS
c:\Demo>hadoop fs -mkdir demo/input/
d) Upload the files into HDFS
c:\Demo>hadoop fs -put TranData* demo/input/
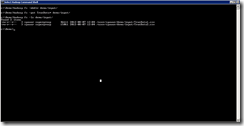
e) View the listing (ls) of the files uploaded to HDFS
c:\Demo>hadoop fs -ls demo/input/
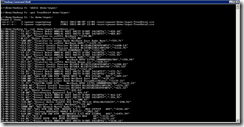
f) To output the contents of the files uploaded to HDFS use the –cat option
hadoop fs -cat demo/input/TranData1.csv
g) Let’s compile the code and make a jar file from the CLASS files.
javac WordCount.java
h) Create a jar file that includes the java program you just compiled:
jar cvf wc.jar *.class
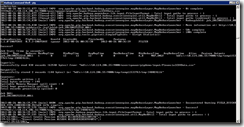
i) Execute the Map Reduce job and the results of it will be created in the demo/output/wordcount directory in HDFS
hadoop jar wc.jar WordCount demo/input/FinancialCSVData.csv demo/output/wordcount
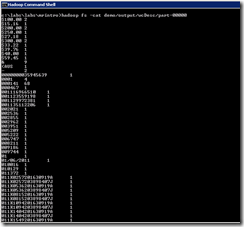
j) View the output file
hadoop fs -cat demo/output/wcDesc/part-00000
As you can see we were quickly able to query the data, we didn't have to create tables, create ETL and then write the appropriate queries. You can see that there was lot of rubbish output, so it is not a silver bullet either, this is were you now need to reiterate your Map Reduce program to improve the results and output as required.
Does this mean I have to be a expert Java programmer?
No it doesn't and this is were Pig and Hive come into play. In fact you will find that about 70% of your queries will either be in Pig/Hive, only for more complex processing will you be required to use Java.
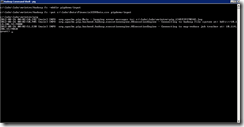
1) To access pig you type pig in the hadoop command prompt:
a) Load the file into the PigStorage which is on top of HDFS. You can also optionally set a schema to the data as defined after the AS keyword below. There are limited data types, don't expect the full range that is available to you in the relational world, remember that Hadoop is relatively new (Hadoop 2.0 is in the works).
grunt> A = LOAD 'pigdemo/input/FinancialCSVData.csv' using PigStorage(',') AS (Trandate:chararray, Amount:chararray, Description: chararray,Balance:chararray) ;
b) Use the DESCRIBE command to view the schema of your data set labeled A.
grunt> DESCRIBE A;
A: {Trandate: chararray,Amount: chararray,Description: chararray,Balance: chararray}
c) Use the DUMP command to execute Map Reduce job to view the data
grunt> DUMP A;
d) Use STORE command to output the data into a directory in HDFS
grunt> STORE A INTO 'pigdemo/output/A';
e) You can FILTER, JOIN the data and keep on creating additional data sets to analyze the data as required.
grunt> B = FILTER A BY Trandate == '29/12/2011';
grunt> DUMP B;
For full capabilities of Pig refer to the Pig Latin Reference Manual - https://pig.apache.org/docs/r0.7.0/index.html
Seeing all this command line interface might be making you sick, is there any graphical interface
There are UIs that are provided on the cluster and through the portal on Azure.
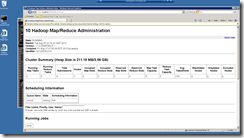
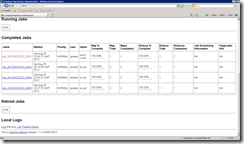
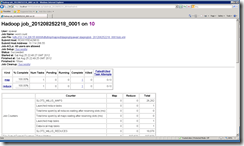
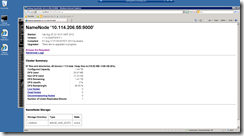
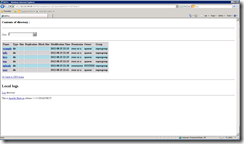
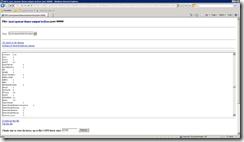
Below are the default pages made available through the Hadoop implementation, they allow you to view the status of the cluster and the jobs that have executed and also browse the HDFS files system.
Below screenshots show case the ability to browse the file system through a web browser including viewing the output.
Hadoop on Azure Portal
The Portal has an interactive console to enable you to run Map reduce jobs and Hive queries without having to remote desktop into the head node of the cluster. This provides a more user friendly interface then just a command prompt. It also includes some rudimentary graphing capability.
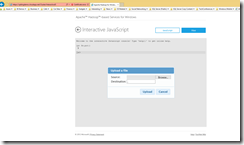
Below is a screenshot of the JavaScript console, allowing you to upload files and Map Reduce jobs to execute.
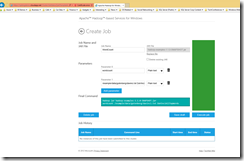
Below is an interface to allow you to create and execute and monitor Map Reduce jobs.
Hive
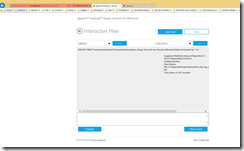
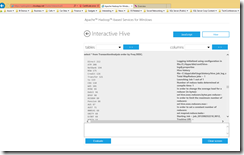
For running the Hive queries I used the Interactive Console in the hadoop on azure portal.
1) As Hive provides a DW style infrastructure on top of Map Reduce, the first thing that is required is to create a Table and load Data into it.
CREATE TABLE TransactionAnalysis(TransactionDescription string, Freq int) row format delimited fields terminated by "\t";
Logging initialized using configuration in file:/C:/Apps/dist/conf/hive-log4j.properties
Hive history file=C:\Apps\dist\logs\history/hive_job_log_spawar_201208260041_1603736117.txt
OK
Time taken: 4.141 seconds
2) View the schema of the table
describe TransactionAnalysis;
transactiondescription string
freq int
Logging initialized using configuration in file:/C:/Apps/dist/conf/hive-log4j.properties
Hive history file=C:\Apps\dist\logs\history/hive_job_log_spawar_201208260042_957531449.txt
OK
Time taken: 3.984 seconds
3) Load the data into the table
load data inpath '/user/spawar/demo/output/wcDesc/part-00000' into table TransactionAnalysis;
Logging initialized using configuration in file:/C:/Apps/dist/conf/hive-log4j.properties
Hive history file=C:\Apps\dist\logs\history/hive_job_log_spawar_201208260046_424886560.txt
Loading data to table default.transactionanalysis
OK
Time taken: 4.203 seconds
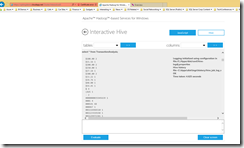
4) Run HiveQL queries:
select * from TransactionAnalysis;
select * from TransactionAnalysis order by Freq DESC;
For more documentation on Hive see - https://hive.apache.org/
Use Excel to access data in Hadoop
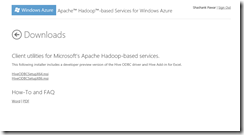
1) On the Hadoop on Azure portal, go to the Downloads link and download the ODBC Driver for Hive (use appropriate version based on your OS version i.e 32 bit vs 64 bit) :
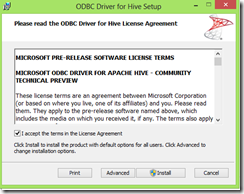
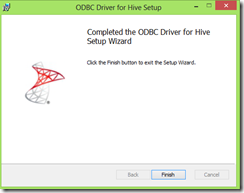
2) Install the ODBC Driver
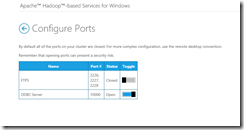
3) Open the ODBC Server port for your Hadoop cluster by going to the Open Ports link on the Hadoop on Azure portal
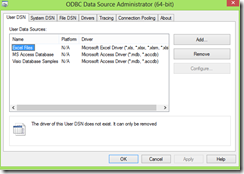
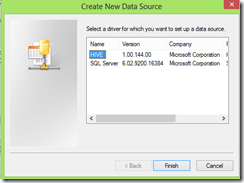
4) Create a User DSN using ODBC Data Source Administrator
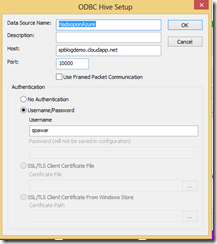
5) Enter the name of the hadoop cluster you had created along with your username
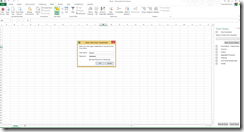
6) Start up Excel, in the Ribbon Bar, select Data and you will see the Hive Pane added, click on it and a task pane will open on the right hand side.
Note: I am using Excel 2013, however the ODBC Hive Driver also works on Excel 2010.
7) After selecting the ODBC User DSN in the drop down box, enter in the password. Once connected select the table from which you wish to get the data. Use the Task pane to build the query, or open the last drop down labeled HiveQL and write your own query.
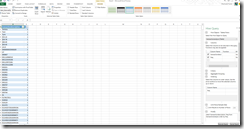
8) Click Execute Query, this will retrieve the data and make it available in Excel
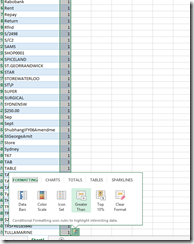
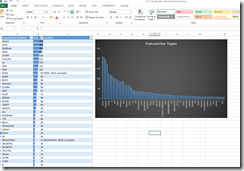
Now that the data is in Excel you can analyse/mash it up using PowerPivot with your other structured data and answer questions as required. As I used Excel 2013, this helps guide me through by providing Quick Explore options to visualize the data by adding data bars and appropriate graphs.
Looking at the frequency of transactions you can quickly tell the makeup of this customer:
- Pensioner
- Computer savvy – as they do Internet banking – the ‘netbank’ keyword was frequently appearing in the transactions'
- Shop in the Ryde area
- Go to Woolworths and Franklins
- Are of ethnic background as they go shopping in Spice shop
Very quickly we were able to get lot of information about this customer.
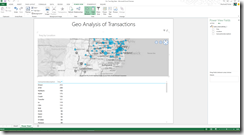
With the power of PowerView in Excel now you can also do powerful analysis such as geo spatial based without having to know geographic coordinates,
For more detailed information of the versions of hadoop running on Azure and also further great tutorials see this blog post from the product team - https://blogs.msdn.com/b/hpctrekker/archive/2012/08/22/hadoop-on-windowsazure-updated.aspx
When talking to customers about Big Data, a question I often get is how do you do backup Big Data?
This is a very valid question and one thing to note about HDFS is that it provides High Availability by default by automatically creating 3 replicas of the data. This protects you against HW failure, data corruption, etc, however it doesn't protect you against logical errors such as someone accidently overwriting the data.
To protect against logical errors you need to keep the raw data so that you can load it again if required, and/or keep multiple copies of the data in HDFS at different states. This requires you to appropriately size your Hadoop cluster so that it not only has space to cater to your requirements but also for your backups.
