Fundamentals: Creating a Workload by Using a Trace Log
This is the kick-off post of a regular Friday series of posts, "Basic Skills for SQL Server ISV Administrators". I have found that ISV Administrators are often Professional Engineers (P.E.) -- rich in business knowledge and light in Information Technology expertise. In this series of posts, I will give visual step-by-step instructions on how to do fundamentals.
A Trace Log is a recording of all of the TSQL sent to SQL Server over a period of time. If you create a backup and record a trace log, then you can use this on a test system to see what impact configuration changes, additional indexes, etc. have on performance. It can also be useful for resolving intermittent problems. A trace log is essential for a valid sampling of TSQL to use for the Database Engine Tuning Advisor.
Step 1: Record a Workload
The first step is to record a workload by using SQL Server Profiler. If you are not familiar with SQL Server Profile, you can get a quick introduction at How to Use SQL Server Profiler. The SQL Server Profiler is located under Performance Tool in the Microsoft SQL Server group on your Programs menu.

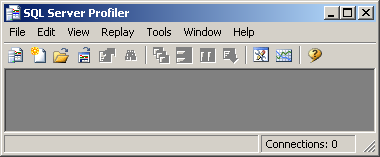
The SQL Server Profiler will now appear.
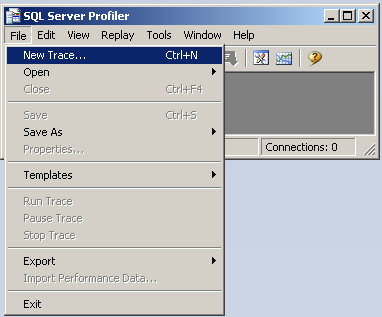
To create a trace, Click File / New Trace
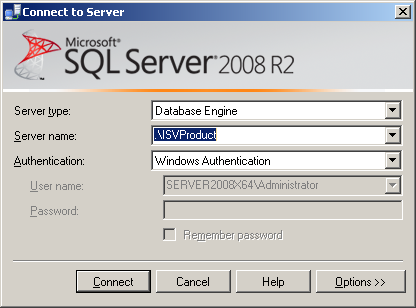
This opens up a Connect to Server dialog. Select the appropriate server to connect to your database.
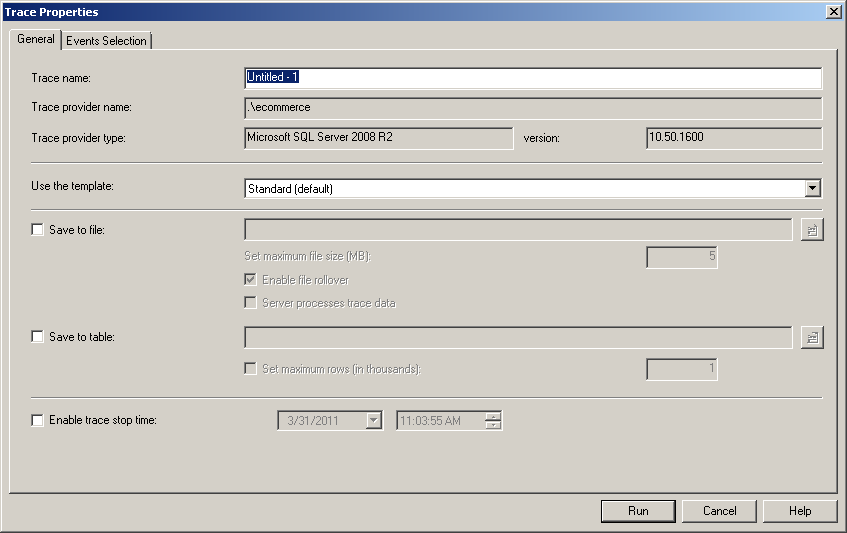
After you have connected, a Trace Properties dialog appears.
If you start SQL Server Profiler and start an arbitrary trace on some ISV databases, you might find yourself frustrated. A single operation on some ISV databases with full tracing and real-world data can result in a 2-GB trace file. If you start a timed trace without a restriction on the size of the capture, you might run out of disk space on your computer when capturing to a local file. Similarly, capturing to a table may fill a hard drive used by SQL Server. If you capture to a table and run out of space, the server that is running your ISV product will stop, to the dismay of your users.
WARNING: Always run SQL Server Profiler on a workstation and record the trace to a local file (on a drive with a lot of space).
You can run a trace in two recommended ways:
- You can use the built-in performance template.
- You can build your own lightweight template.
The first approach is the easiest. In the Trace Properties dialog box, click the General tab, and then select theTuning template.

This is a reduced template, as illustrated by the following figure.

Step 2: Write to a File
The next step is to write to a file so that you can limit the amount of data that is written. You do not want to give a blank check on your disk space to SQL Server Profiler. You might be tempted to try to write to a table and limit the table to only 10,000 rows; even that can result in a huge table because binary large objects (Text, NText, and Image) will be written to this table. For example, 10,000 rows x 10-MB document = 100 TB. Do you have a spare 100-TB hard drive on your system?
The safest solution is to see how much free space you have on a local desktop drive and divide that by 2. Use the resulting value for the maximum trace file size. The file will stop growing when it reaches this size, or it will be smaller. If you must run it on the server, try doing so on a logical drive that is not used for any database file. You want to minimize the impact of tracing on SQL Server. For more information, you may want to review Flash Tip: Running Profiler on a Busy SQL Server on TechNet.
The purpose of SQL Server Profiler is to capture a typical workload. It should run during the workday and preferably on a quiet workday so that it will not have a noticeable impact on your users. A general rule of thumb is to capture 1 hour of activity or until you run out of the allocated disk space for the log. To do this, click to clear the Enable file rollover check box (so that it will stop logging when it runs out of space). If you select the Enable file rollover check box, the log will keep recording and will keep only the last activity.
These steps produce a trace log that we will use in the next part of this series.
Create Your Own Trace Template
If you find that the Tuning template still results in huge files, you may want to create a very lightweight template that resembles the following.

For more information, see How to Create Workloads and How to Create a Trace on MSDN.
Potential Issues
Watch out for the following issues:
- If you have tightened security on SQL Server, specifically if you have used the SHOWPLAN permission, the log may not be usable for Database Engine Tuning Advisor.
- In general, it is best not to capture the login name and to let Database Engine Tuning Advisor use the login name that you use to connect to your ISV SQL Server database (which must have the SHOWPLAN permission).
Next Time
In the next part of this series, I'll look at using these logs as a workload in Database Engine Tuning Advisor to identify missing indexes that may improve the performance of SQL Server.