Hidden Gems #14: Dig for knowledge in your Excel data

You no doubt store lots of raw data in Excel spreadsheets. Then you probably use Functions to simplify and automate calculations in those spreadsheets. Now you have even more information. And you have probably spent plenty of bleary-eyed hours scanning it. This month, I’m on the trail of a raft of Excel Functions specifically designed to help you pick out useful trends from your raw data, directly in your spreadsheets.
Case Notes...
The Target: Excel 2010 and Excel 2007; some functions also available fully or in rudimentary form in Excel 2003.
Whereabouts: Included in Office 2010 “Home and Business” or “Professional” Editions, or available standalone from the Microsoft Store.
Modus Operandi: Examine and assess data stored in Excel spreadsheets.
Appearance:
Case History...
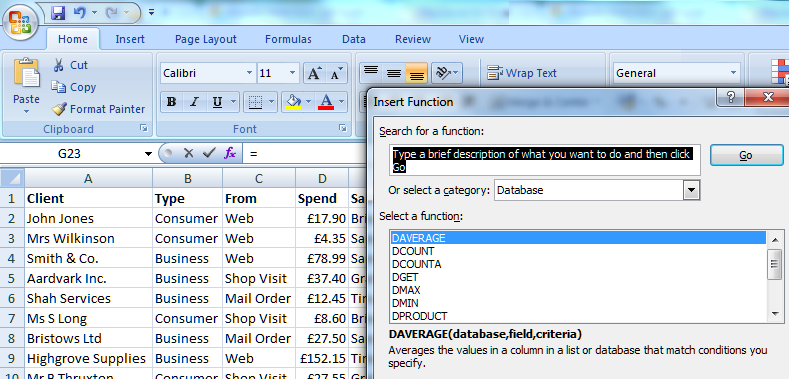
Everyone knows that Excel is superb for sorting out calculations. But the range of functions available has grown steadily since Excel’s inception; which is a good thing, because the demands of a small business have grown too. We want more than just financials and amortisation because we use Excel for more than just keeping the books. Many businesses use Excel as a database for everything from customer records to stock lists and product catalogues. Excel is therefore now equipped with a range of database interrogation functions to help you make sense of all that data, which means you can extract actionable management information. Here are a range of examples.
DMAX and DMIN
The MAX function extracts the maximum value from a list. The DMAX function digs out the maximum value from a list, filtered by an array of values of your choice. By way of demonstration, we return to a spreadsheet which, if you have been following the “Hidden Gems” series will now be all too familiar! It’s a typical list of transactions and the salespeople who made the sale. Let’s take a look at the spreadsheet:
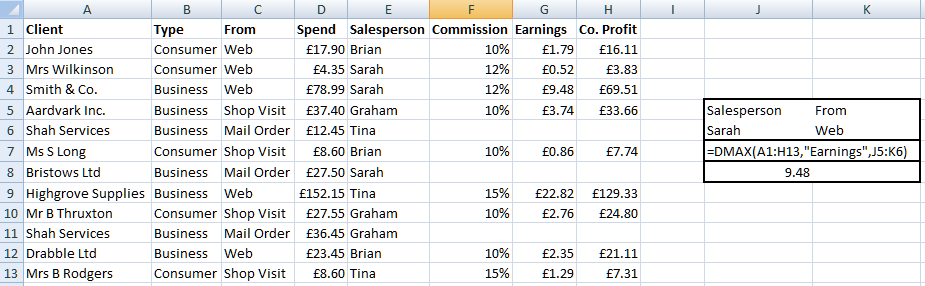
In this example, the DMAX function is used to assess the whole spreadsheet - A1:H13 refers to the whole dataset. In that dataset, we have instructed DMAX to look for a maximum in the “Earnings” column. Note that unlike the MAX function which needs a range, you can use a simple column name. And even more usefully, the DMAX function’s final argument (arguments are the bits in brackets after a function which tell it what to do) is another range;
in this case J5:K6. That final argument defines the range in which the filters are shown. If we look at the range expressed in J5:K6, it tells us that we should filter for Salesperson Sarah and transactions which are From the Web.
So, =DMAX(A1:H13,”Earnings”,J5:K6) looks for the maximum value in the Earnings column, filtered for Sarah’s Web transactions only. The result shown is £9.48. There’s a DMIN function which finds minima in exactly the same way.
DAVERAGE, DSUM and DPRODUCT
The AVERAGE function calculates the average of a list of numbers. The DAVERAGE function, on the other hand, calculates the average of a list of numbers, first filtered by an array of values of your choice. Let’s return to the spreadsheet:
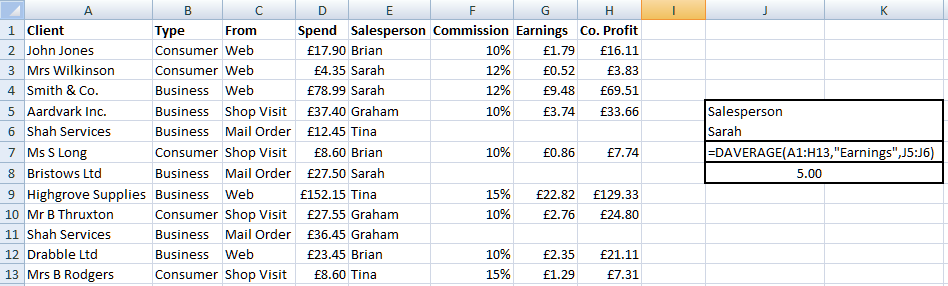
In this example, just as with DMAX, we have assessed the whole spreadsheet (A1:A13); we’re looking for an average which will be based on the Earnings column, and in this case we are filtering only for one further parameter, namely Salesperson Sarah again. Hence, the filter range is now set to J5:J6. So, =DAVERAGE(A1:H13,”Earnings”,J5:J6) looks for the average of Sarah’s commission earnings – a healthy £5.00! Note
that DAVERAGE is perfectly happy with blanks (it ignores them) – indeed one of Sarah’s transactions has no data yet, and it is simply ignored from the filter.
DAVERAGE is of course excellent for management analysis – simply change the name from Sarah to find out any of the other salespeople’s average earnings. Here, for example, is proof that Brian is not quite as high-powered...
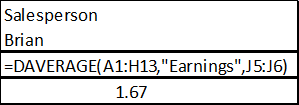
Note that the DSUM and DPRODUCT functions work in exactly the same way; instead adding or multiplying rather than averaging the filtered results.
DCOUNTA
The DCOUNTA function counts the number of non-blank records in a list of records, first filtered by an array of values of your choice. Not surprisingly, count the number of records and then the number of non-blanks to find out how many blanks there are (and therefore how incomplete your records). Here’s the spreadsheet:
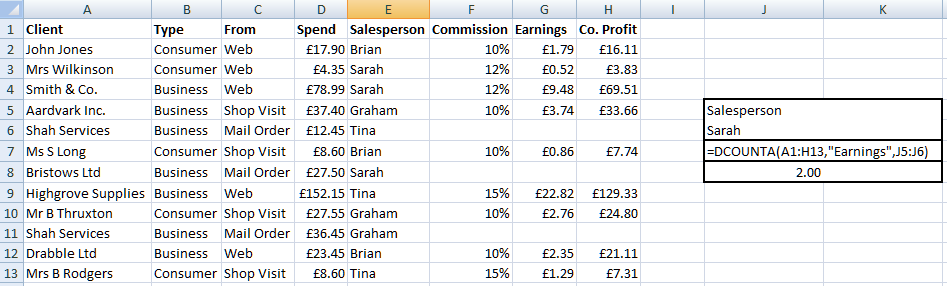
Once again, we are only looking at Salesperson Sarah; and the DCOUNT function tells us that there are two non-blank records assigned to her.
Under the magnifying glass...
There are several more database interrogation functions you might like to investigate:
- DGET – Pick a single record from the spreadsheet
which matches your specified criteria. - DSTDEV – Similar to DAVERAGE and DPRODUCT,
calculates the statistical standard deviation of the selected filtered records - DVAR – Calculates the statistical variance of
the selected filtered records
The target exposed
Find out more:
Excel Database Functions, one by one
Everything you ever wanted to know about Functions... and more