Business Intelligence (BI) with Excel 2010 and PowerPivot in SharePoint 2010
This is the second article of a series to review the following five BI vehicles in SharePoint 2010:
- Overview
- Excel 2010 and PowerPivot
- Excel Services
- Visio Services
- PerformancePoint Services
- Reporting Services and Report Builder
 Excel 2010 and PowerPivot introduces a fascinating integration. PowerPivot, a data analysis tool and free add-in to Excel 2010, gives users the power to create compelling BI solutions right at from an individual's desktop. With this add-in to Excel, a user can transform mass quantities of data with significant speed into meaningful information to facilitate decision making. Excel with PowerPivot is, in essence, a user-driven, self-service solution model with minimal infrastructure dependency. For those who need a quick and user-driven BI solution with minimal infrastructure dependency, Excel 2010 with PowerPivot is a great candidate.
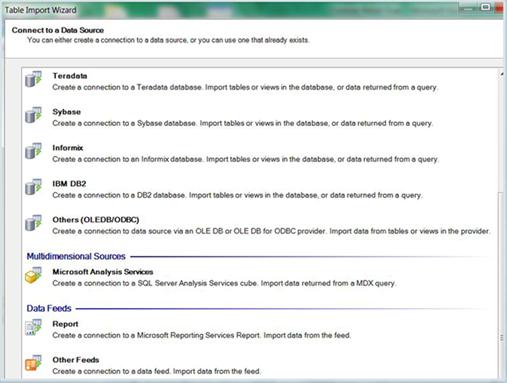
PowerPivot, natively supports various data stores, SQL Analysis Services, and data feeds as shown above. Once in place, PowerPivot has an in-memory engine capable of processing millions of rows of data with impressive performance. At minimum, 1 GB RAM is expected to run PowerPivot. The actual RAM needed will obviously depend on the amount and business logic that PowerPivot carries. The computing power is delivered directly within Excel with a consistent user experience. At an operational level, an Excel user will be able to employ PowerPivot very easily with just routine Excel end-user operations, i.e. mouse-clicks, cut-n-paste, etc. It's a very cost-effective way to analyze large amount of data for achieving business insight and shortening decision cycles. There is also an integration of PowerPivot with SharePoint 2010 (see below) that scales this self-service BI model to an enterprise level.
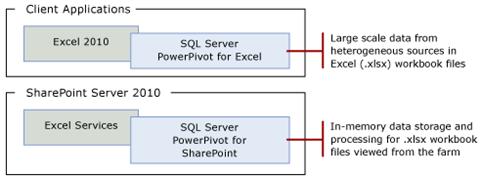
PowerPivot for SharePoint adds services and infrastructure for loading and unloading PowerPivot data. After creating a PowerPivot workbook, one can save/publish it to a SharePoint server or farm that has PowerPivot for SharePoint and Excel Services installed. This adds collaboration and document management support for a published PowerPivot workbook. In SharePoint, while the PowerPivot services processing the data, Excel Services renders it in a browser session. The SharePoint integration enables users to share data models and analysis. By configuring refresh cycles, the data can stay current automatically. Further, a published workbook may become the basis for Reporting Servicesreports created by other authorized SharePoint users, repurposed in other PowerPivot workbooks, or linked to from different sites, possibly in different farms. There are many interesting business scenarios and possibilities with PowerPivot. To learn more, https://powerpivot.com/ is a great resource.
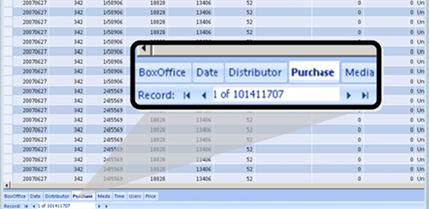
Is There A Need for Processing Millions of Rows of Data
A key delivery of PowerPivot is the ability to process millions of rows of data. Here the amazing capacity of sorting more than 100 million rows on a desktop delivered by Excel 2010 and PowerPivot is shown below.
In some of my TechNet events, a few IT professionals nevertheless told me they would never need to process millions of rows of data in Excel. I was not surprised with this response and, in a way that was very true.... till the introduction of PowerPivot. In my view, the capacity and performance limitations then existed in hardware and software making it not practical to process extremely massive amount of data in a desktop environment. That was not because there had had no need for processing very large amount of data. Companies would need to spend a lot of time and money; contracting it out or having a developer team to develop, produce, and maintain reports for making business decisions. I can vividly remember in mid 90's while working as a consultant, many of my engagements were to fix business logic and improving the performance of COBOL reports based on large amount of data. When it comes to statistical models, demographics, trend analysis, optimization, information portal, etc. data will never be too much and the demands have been always there. The difference is reports used to take hours of a team of specialists and operators to implement and much CPU time to generate, now available in seconds at the finger tip of an information worker running Windows 7 desktop and Excel 2010 with PowerPivot.
And just like many of us once argued 1024x768 resolution would be more than enough for word processing and email routines, while today few works with a low resolution screen anymore. Not too long ago, I thought Instant Messaging was counterproductive, while today it is a necessity for me to be productive and take care of business every day. So, does everyone need the ability to process millions rows of data? Maybe not, not yet. I do however believe as PowerPivot is becoming a standard add-in for Excel 2010, businesses will soon expect the ability and performance to process extremely large amount of data from multiple data stores are and will be readily available with a PC desktop. The question is and will not be if data can be analyzed, but what to analyze and how good the analytical model is. Above all, PowerPivot is for:
- Excel users who know how to structure, analyze, and calculate multidimensional data in workbooks and PivotTables.
- SharePoint users who use team sites and document management features to store information and collaborate with colleagues.
- Database professionals and IT pros who want to delegate business data development tasks to those who need the data most, but want to retain sufficient controls so that data can be secured, monitored, reproduced, and archived.
The empowerment through a self-service model to derive business intelligence right on the desktop and the immense capacity offered by PowerPivot as a free add-on, together makes this solution a must-have for conducting data analysis.