Business Intelligence (BI) in SharePoint 2010
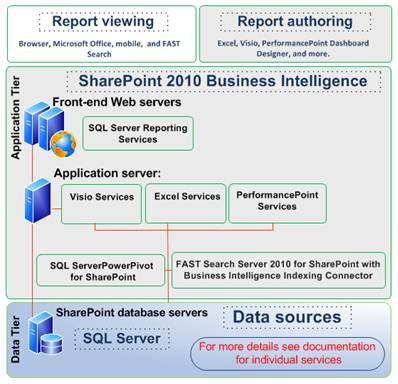 BI is a concept encompassing many areas of IT and like many other IT terms, it means different things to different people. One simple definition of BI is “Using of analytic and visualization tools to better understand and interpret data.” Recently there have been active discussions on BI as a priority in CIO’s list. Interestingly, the more we talk about BI, it seems the bigger the scope BI has. Indeed, PowerPivot, Excel Services, PerformancePoint, etc. these tools and features can sound confusing and overwhelming. To better understand BI, I find a great review discussing How SharePoint 2010 brings BI to the next level and a nicely done poster, Getting started with business intelligence in SharePoint Server 2010, are both very interesting and informative.
Notice there are three areas of BI, i.e. at individual, community, and organizational levels. SharePoint 2010 addresses these areas as a whole with various vehicles including: Excel and PowerPivot Add-in, Excel Services, PerformancePoint Services, Visio Services, and Reporting Services and Report Builder as depicted below. And it is important to keep the context in mind of a BI scenario that is being assessed such that the best vehicle, namely right tools and the best-fit features, will become evident.
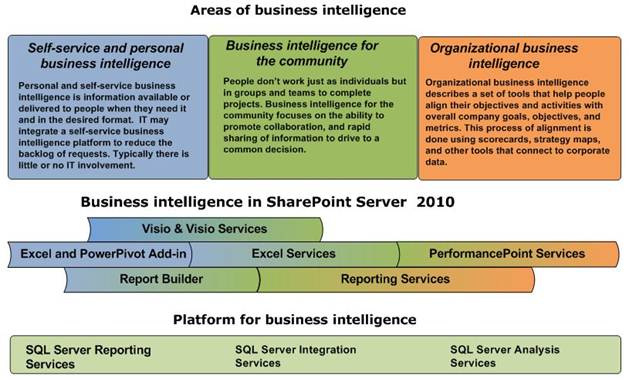
(Source: Getting started with business intelligence in SharePoint Server 2010)
This is an overview of a series of articles to review the following five BI vehicles in SharePoint 2010:
- Excel 2010 and PowerPivot
- Excel Services
- Visio Services
- PerformancePoint Services
- Reporting Services and Report Builder
Also I highly recommend reviewing a great series of Office and SharePoint relevant content publsihed by Dan Stolts, one of my fellow Evangelist based in Boston area.
- Planning for Office 2010 and SharePoint 2010
- SharePoint and Office 2010-Part I-An Inside Look At Outlook 2010 and SharePoint 2010 People Search
- SharePoint and Office 2010-Part II-An Inside Look At PivotTables and SharePoint BI Integration
- SharePoint and Office 2010-Part III-A Glance at SharePoint-PowerPoint-Word