SharePoint 2010 Usage and Health Service
SharePoint 2010 Usage and Health Service
Little bit background on Usage and Health services in SharePoint 2010:
SharePoint 2010 Usage and Health Service is a great new feature for SharePoint Administrators when it comes to analyzing usage of SharePoint environment or troubleshooting a SharePoint Issues.
In the earlier days of SharePoint there was no place to get consolidated logs for SahrePoint Farm, so to troubleshoot any issues admins has to go to each SharePoint Server to collect different logs (ULS, IIS, Event Log, etc).
Now with SharePoint 2010, if Usage and Heath Service Application is configured and running all the logs from all SharePoint servers flows into Usage and Health Database on SQL Server and can be sliced and diced using TSQL!
There are broadly two types of data collected by this service 1.) Usage data and 2.) Health data.
1.) Usage Data
This is the data about usage on SharePoint Farm, like Page requests, feature use, search query latency, etc. This data is similar to IIS log, however unlike IIS logs this has addition SharePoint specific data collected like Application ID, Site ID, Web ID, Correlation ID etc.
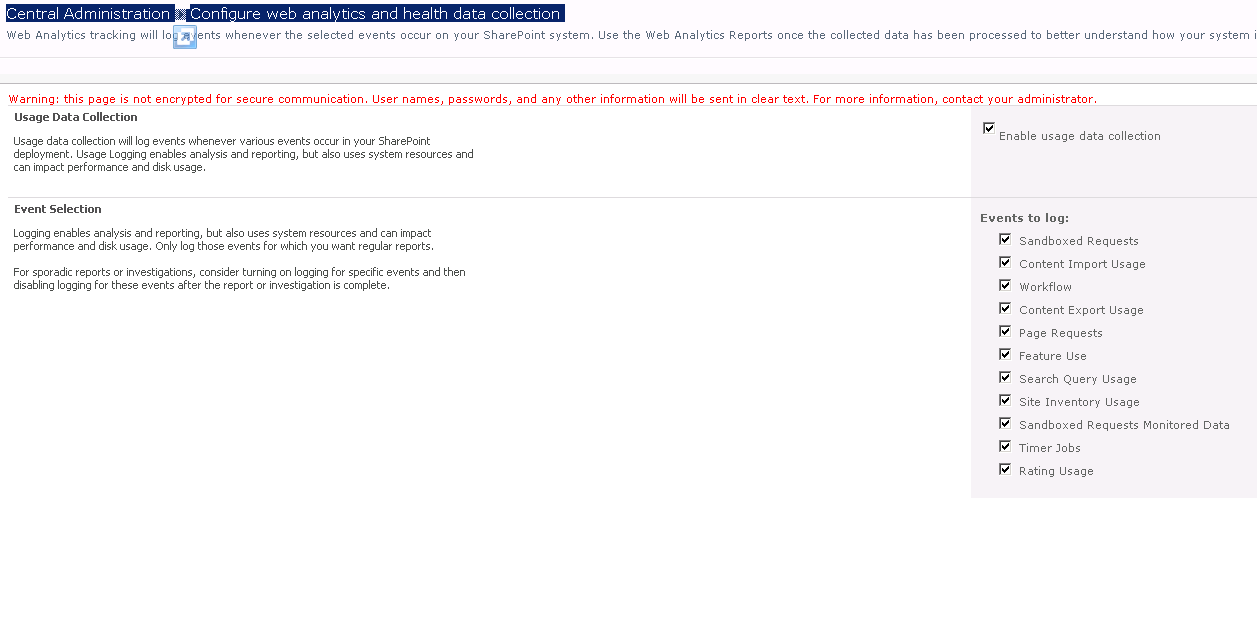
To configure which events should be logged in usage database goto Central Admin-->Monitoring-->Configure Usage and Health data Collection there is option to select different events.
Usage data is initially stored in Usage Log file (.USAGE ) on SharePoint Server under logging directory which is later processed by Microsoft SharePoint Foundation Usage Data Import Timer job that runs every 30 min into Usage Database.
There is another timer job Microsoft SharePoint Foundation Usage Data Processing, this job checks for expired usage data at the farm level and deletes data.
Expired usage data consists of records in the central usage data collection database that are older than 30 days.

Generally it is not supported to directly query SharePoint databases; however Usage database is the only one which can be queried using SQL Management studio.
Usage Database contain 32 [0-31] tables for each data provider and consolidated data views to query data.
Following is the mapping of Usage events to Usage Database data views.
| Usage Events | Database View |
| Sandboxed Requests | SandboxedRequests |
| Content Import Usage | ImportUsage |
| Workflow | WorkflowUsageTelemetry |
| Content Export Usage | ExportUsage |
| Page Requests | RequestUsage |
| Feature Use | FeatureUsage |
| Search Query Usage | [Views in usage database starting with Search_ |
| Site Inventory Usage | SiteInventory |
| Sandboxed Requests Monitored Data | SandboxedRequestsMonitoredData |
| Timer Jobs | TimerJobUsage |
Usage Reports:
Following reports surface usage data to user and can be accessed from Cenntral Admin -->Monitoring section :
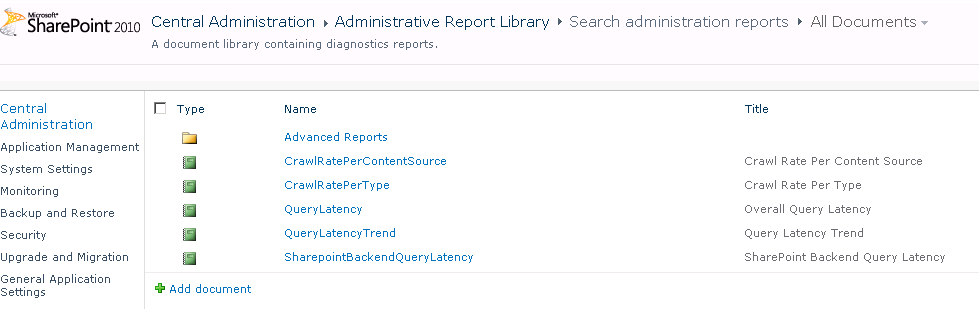
Administrative Reports:
CrawlRatePerContentSourceCrawlRatePerType
QueryLatency
QueryLatencyTrend
SharepointBackendQueryLatency
Advance Reports:
CrawlProcessingPerActivity
CrawlProcessingPerComponent
CrawlQueue
Other:
Slowest Pages
Top Active Users
This usage data is also pushed to Web Analytics Service application(if enabled) staging database using Microsoft SharePoint Foundation Usage Data Processing timer job for generating web analytics reports.
2.) Health Data
This includes SharePoint ULS, Windows Event Logs, Performance Contents and SQLDMV. This is a very useful database when troubleshooting SharePoint issues.
Health data on a SharePoint Farm is processed by multiple Diagnostic Data provider timer jobs and runs on all sharepoint servers in the farm and moves data from different logs sources to usage database.
Following is list of Timer Jobs and corresponding database views for different OOTB diagnostic data provider.
Timer Job |
Database View | Timer Job frequency |
Diagnostic Data Provider: Event Log |
NTEventLog | 10 minutes |
Diagnostic Data Provider: Performance Counters – Database Servers |
PerformanceCounters | 5 minutes |
Diagnostic Data Provider: Performance Counters – Web Front Ends |
PerformanceCounters | 5 minutes |
Diagnostic Data Provider: SQL Blocking Queries |
BlockingQueries | |
Diagnostic Data Provider: SQL DMV |
SQLDMVQueries | 30 minutes |
Diagnostic Data Provider: SQL Memory DMV |
SQLMemoryQueries | |
Diagnostic Data Provider: Trace Log |
ULSTraceLog | |
To view health data one option is to connect to SQL Server and directly query database views, however I recently came across a codeplex solution https://spflogger.codeplex.com/ to view usage and health logs.
Health data can also be surfaced using SPDiag 3.0 another great tool.
How to Provision Usage and Health Service
Using Powershell:
New-SPUsageApplication -Name “UsageAppName” -DatabaseServer “DBServerName” -DatabaseName “DBName”
Change retention period using PowerShell:
Set-SPUsageDefinition -Identity <GUID> [-Enable] [-DaysRetained <1-30>] [-Verbose]
Central Admin GUI:
Go to Central Admin-->Monitoring-->Configure Usage and health data collection-->Select Enable usage data collection
AutoSPInstaller
If using scripted install using AutoSPInstaller configures Usage and Health Serive Application using AutoSPInstaller Input file
<UsageLogs Compress="true">
<!-- The default <UsageLogDir> is $Env:CommonProgramFiles\Microsoft Shared\Web Server Extensions\LOGS - enter another path (e.g. D:\Logs) or leave <UsageLogDir> empty to use the default. -->
<UsageLogDir></UsageLogDir>
<!-- <UsageLogMaxSpaceGB> must be between 1 and 20 GB. Leave empty to use the default (5 GB) -->
<UsageLogMaxSpaceGB></UsageLogMaxSpaceGB>
<!-- <UsageLogCutTime> specifies the time, in minutes, of usage data collected per usage log file (acceptable values are between 1 and 1440, default 5). Leave empty to use the default. -->
<UsageLogCutTime></UsageLogCutTime>
</UsageLogs>
<SPUsageService Provision="true"
Name="Usage and Health Data Collection">
<Database>UsageAndHealthDB</Database>
</SPUsageService>
SharePoint Usage and Health Database best practices:
- There is just a single database per Farm for usage and health data collection and it may get really big sometimes, so make sure to include this one in capacity planning.
- Usage and health database is very active and should be put on separate disk or spindle or sperate database server if possible.
- Database size depends on the retention factor, number of items enabled for logging and external monitoring, how many Web applications are running in the environment, how many users are currently working, and which features are enabled.
- The Usage and Health Data Collection database is very write-heavy.
Good Reads:
If you are planning to extend SharePoint Usage and Health functionalities following article by Todd Carter is a great read: https://todd-carter.com/post/2011/04/26/Extending-The-SharePoint-2010-Health-Usage-Part-1-Feature-and-Capability-Overview.aspx