컴퍼넌트 수준 성능 분석 도구 소개 - BinaryWave Sonar
SharePoint 사이트 상에서 성능 문제가 발생했을 때, 성능을 저하하는 원인이 무엇인지 server control, html control, web part와 같은 컴퍼넌트 수준으로 성능을 분석할 수 있는 도구가 미국 개발사인 BinaryWave사에 의해 릴리즈되었습니다; [상세보기]
본 도구는 특히 개발을 통한 커스터마이징을 적용했을 때 성능 저하를 일으키는 코드가 무엇인지 찾아내는데 도움이 됩니다. 본 도구는 무료 버전과 유료 버전이 있으며 보다 상세한 사항은 다음 내용을 참고해 주십시오.
Solution Overview
Performance analysis in general has many facets and a multitude of solutions to fit each unique scenario. In the realm of web application performance analysis, many solutions focus on measuring the delivery of rendered markup to the requesting client - measuring load and render times, factoring connection speed and host capabilities, determining geographical dependencies, and so forth. These are all perfectly valid and necessary measurements; however, they are only one slice of the overall performance measurement spectrum. Of immediate concern to developers and system administrators is the ability to obtain a baseline level of server-side performance before such varying factors as client browser type, location, operating system and connection speed are factored into the equation. Like these other measurement types, server-side metrics are not, and should never be considered as, the final word on application performance. But they do provide a very clear picture into how an application is behaving in it's 'raw' state, before anything other than the local environment influences the results.
With this in mind, it is important to understand what Sonar is and what it is not. As a benchmarking tool for server-side performance analysis, Sonar gives raw (other than that processing and interpretation which is naturally inherent in the .NET framework) object execution results; it simply measures the time it takes for individual page controls, be they images, scripts, ASP.NET server controls, or SharePoint web parts, to execute from start to finish when requested by actual users. These metrics do not always coincide with those obtained from other tools and they rarely ever will - they are "point in time" indications of what was happening on the server at that particular moment in the context of a singular request. Over time, these results form a very clear and precise picture of how the underlying application is performing on a daily, hourly, or even minute-by-minute basis.
Technical Architecture
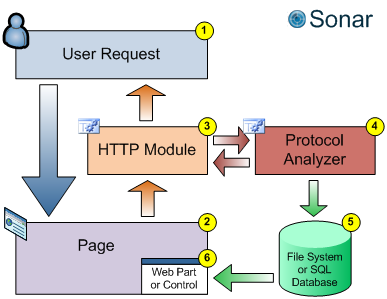
From the outset, we envisioned a tiered product offering comprised of a set of web part solutions for developers and small-to-medium sized farms and an enterprise product with utilizing application pages to deliver canned and ad-hoc reports. Since the Professional model would not utilize web parts (primarily to support public-facing MOSS WCM sites) it was necessary to construct a lightweight data collection architecture that could gather performance statistics on-the-fly as pages are rendered, without the collection process itself having a detrimental impact on the pages being analyzed. This required a custom HTTP module, a set of object parsing assemblies, data presentation web parts and application pages.
In Sonar Lite and Standard editions, performance data collected by the page analysis routines is written locally to a set of XML files, which are then parsed by the web part for presentation purposes and which can also be exported for additional analysis within Microsoft Excel or Access. As neither the Lite or Standard versions offer historical reporting or point-in-time snapshot analysis, there is no requirement for a stand-alone database or the use of SharePoint lists to store and retrieve data, although the list storage model would be perfectly feasible for this type of scenario. A SQL database separate from the server farm databases is used by Sonar Professional to store object data and the reports are generated using a combination of custom C# code and third-party graphing utilities.
Data Collection
Naturally, the primary concern when creating performance measurement tools is to insure that the tools themselves do not have a negative impact upon application performance. Although it is impossible to be completely transparent to page execution when wiring code into the base page framework, Sonar routines attempt to be as lightweight and performant as possible. This is of particular concern when creating HTTP modules to be deployed within a MOSS framework, as MOSS employs its own set of HTTP modules to manage user request data, page redirection, publishing features, and a host of other functions. Adding further overhead to these processes by deploying yet another assembly which interacts with the response data being delivered to the user is fraught with peril - one mistake in an ill-formed method can result in a significant degradation in the user experience (and can also impact base SharePoint functionality). This is also true of the pure web part model although the risk is lessened by response manipulation only being performed on-demand for specific pages.
The Sonar data collection process consists of a custom HTTP module which parses each page requested by the user. It builds a collection of high value control elements to be analyzed while filtering out those of lower value that have little relevance to the user experience (HTML structure tags such as tables and DIVs, empty placeholders, and certain types of ASP.NET web controls, including the Sonar web part itself). It then passes this collection of controls to a multi-threaded protocol analyzer assembly for analysis and sends the page on to the user as originally requested. Once all relevant controls have been processed, the data for each control, along with higher-level statistics for the page itself, is written to a set of local XML files, which the display web part will then parse and present in an easy-to-read format. Sonar Professional utilizes the same in-band analysis but stores the data in a SQL database and all output is viewed in a set of custom application pages in the /_layouts/sonar directory.
Obtaining control performance is dependent upon the type of control being processed. For ASP.NET controls, including web controls, server controls, user controls, and the like, the individual object event handlers are the key to inserting a listener into the execution process. The load and unload events of each control must be overridden and timers inserted to track component begin and end times. Garbage collection plays a key role in this process as many controls are unloaded in batches; that is, they are kept resident (and technically still in a loaded state) until the garbage collector comes along and cleans up items in the queue (which is a vast oversimplification of how garbage collection actually works but the overall metaphor is applicable here).
SharePoint web parts (and, of course, ASP.NET web parts) are a type of server control but they behave in a unique manner and expose different information than a base control. Web part performance information can be obtained by treating them as server controls and getting their type value to create a web part group but they may also be accessed via the page's SPWebPartManager object. Each page in MOSS and WSS has one (and only one) web part manager object whose chief responsibility it is to keep track of all web parts on the page. This object can be accessed directly from within the page context (i.e. this.page.WebPartManager) or out-of-band by getting the SPLimitedWebPartManager object using the GetLimitedWebPartManager method. Which method is used is up to the individual developer and the calling context; while the SPWebPartManager object is perfectly accessible inside of a web part, invoking the SPLimitedWebPartManager is the best method for getting web part data from an HTTP module or handler assembly that does not have access to the post-rendered context of a page.
For HTML controls and linked or embedded objects, the only practical way to measure performance is to make a request to the object URI and time the response. While quite simple for pages which utilize no authentication mechanisms, this task can be made quite complicated by the need to pass valid user credentials to the remote server, especially if the remote host is also a SharePoint server in a complicated domain architecture, requiring impersonation techniques to pass credentials to the remote host. Like ASP.NET controls, careful filtering is required to ascertain which HTML controls have a potentially high-value performance impact and which are simply filler or formatting objects. Sonar uses a DOM-parsing method to obtain and analyze the HTML components but other mechanisms, such as Regular Expressions, may also be used to build an array of controls for further processing. Once the array is populated, the URI's are passed to the protocol analyzer object for retrieval and generation of performance statistics.
Of particular note to developers wishing to create their own performance measurement solutions within SharePoint are the vast differences between WSS pages, which appear to the processing assembly as a standard System.Web.UI.Page object, and MOSS publishing pages, which are altogether different. While MOSS pages utilize the underlying ASP.NET 2.0 framework, they also employ a complicated redirection and page processing mechanism which is mostly obfuscated from the HTTP response stream. While they may look at first glance like simple page objects they are actually derived from the Microsoft.SharePoint.Publishing namespace and employ two tiers of content manipulation within the TemplateRedirectionPage and PublishingLayoutPage classes. This is transparent to a post-rendered objects like web parts and server controls, which access the Page object context after MOSS has performed all the requisite manipulations, but HTTP Modules interact with the Page object prior it being passed on for rendering. Attempting to inject code into the page object in this scenario, such as wiring up event listeners to obtain performance data, requires additional logic to extract the redirected page object from the SPHTTPHandler constructor before it can be handed off to a custom module for analysis.
Data Presentation
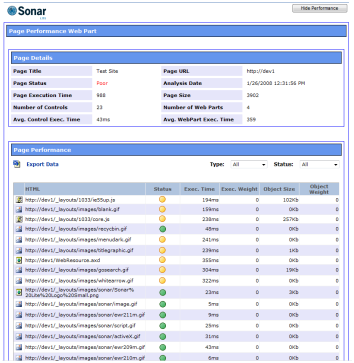
Performance measurement data is presented in Sonar Lite and Standard as an ASP.NET 2.0 Web Part and in Sonar Professional in a generic server control hosted within an application page in the /_layouts/sonar directory. Because both the Lite and Standard versions deliver metrics only for a single page, a Web Part provided the most flexible presentation mechanism. It can be dropped onto any page within a WSS site collection in order to view performance statistics for that page. Data is presented in a simple grid with raw and weighted average metrics and red-yellow-green stoplight indicators. In order to prevent control rendering from slowing the page on first load, the grid is not rendered until the user clicks the "View Performance" button. This action invokes and event handler that loads the XML data files, parses the control statistics, populates and renders the grid.
Due to the fact that Sonar Professional operates behind the scenes on all requested pages, a different methodology is required to render output. A split-panel, Windows Explorer-type control allows the user to browse the site hierarchy and select which page metrics should be displayed. Summary statistics are available from the root node of the site or site collection. The same basic metrics are provided but the user has the ability to define threshold levels for the stoplight indicators and specifically include or exclude individual pages or url paths. The Professional version also provides point-in-time historical data and graphing (via Dundas Chart for SharePoint) to analyze performance trends on a page-by-page basis for a specified time period. As with the other versions, the entire dataset may be exported in XML format for further offline analysis. With the notable exception of the Dundas controls, the entirety of the selection and display content is rendered using out-of-the-box .NET controls, including the treeview and detailed gridview, which derive their data from an ADO.NET connection to the SQL database.
The Bottom Line
Sonar metrics serve as a baseline representation of application performance. They are weighted to overall page size or execution time for comparative purposes and are independent of any client-side operational overhead. This is an important distinction, especially to developers wishing to obtain an unfiltered measurement of raw processing time. Once the code has executed, the rendering process is completely out of the developer's control; they can only optimize the functions inherent within their program. Any further processing and rendering, even that performed by controls higher in the control collection or which execute earlier/later in the page lifecycle, skews the metrics and makes optimization much more difficult.
It is possible and, in fact, desirable, to combine server-side and client-side metrics to obtain end-to-end performance measurement data; however, without a "raw" baseline number for server-side execution time, page components can be mistakenly pinpointed as bottlenecks when the real problem may exist within a related control, be injected into the response by network latency, or be caused entirely by client settings and configuration (or, for that matter, by SharePoint itself). The true value proposition of Sonar and related technologies is the ability to give IT managers and developers a clear window into what is happening inside the application before any outside influences can take effect.
Deployment
Implementation of Sonar Lite and Sonar Standard requires the registration of several DLL files, a SharePoint Feature and associated Feature Receiver, images, styles, web parts, and modification of the web application web.config file (to register safe controls and HTTP modules). While all of these items could be deployed via script or a structured installation program (such as a Windows Installer MSI package), SharePoint already contains a robust and flexible code deployment mechanism. By bundling all of the required resource files into a single cabinet archive - known as a Solution Package or WSP file - administrators have the ability to control code deployment and rollback in much the same manner as installing/uninstalling a Windows program. Using the Central Administration UI and STSADM command-line utility, the Sonar solution package can be deployed in minutes to any SharePoint farm without concern that difficult to manager code is being injected into the server maintenance routine or that unsupported implementation methods are being utilized. The requisite features can be activated on a site-by-site basis ("Web" scoped, in SharePoint parlance) and retracted or removed as necessary.
Conclusion
Developers will face a number of challenges in creating server-side performance measurement solutions similar to Sonar, most notably the deep level of interaction required with the SharePoint API and the need to produce code that has a negligible impact on the pages being measured. A solid understanding of object model programming is required, along with an understanding of network protocols, Internet Information Server, ASP.NET, and Microsoft server technologies. While Sonar fills a gap in the performance measurement spectrum by providing component-level performance data for WSS 3.0 and MOSS 2007 sites, it is intended to be used in combination with network and client analysis tools as part of an overall performance management strategy within the enterprise. The particular needs of each organization may require the creation of additional tools and utilities to gain a clear understanding of application performance; to this end, understanding how Sonar works can aid SharePoint developers in creating point solutions to improve troubleshooting techniques, increase response times, and generally improve the return on investment from the implementation of SharePoint within the enterprise. If you have constructive ideas or proven techniques (or tools) for how to effectively measure SharePoint performance, please leave a comment here.
The Sonar Team at BinaryWave