Process Monitor 2 Released - Now with more cowbell!
If you have any need to find out what your computer is really doing under the hood, you know that Process Monitor is the tool. Today, Process Monitor 2.0 was released. From the Sysinternals blog:
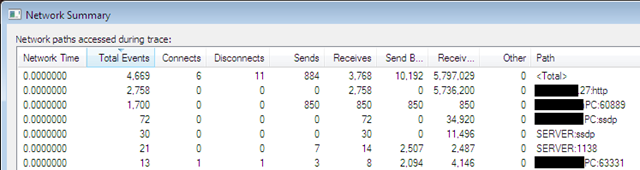
This major update to Process Monitor adds real-time TCP and UDP monitoring to its existing process, thread, DLL, file system and registry monitoring. You can now see the TCP and UDP activity processes performed, including the operation (e.g. connect, send, receive), local and remote IP addresses and DNS names, and operation transfer lengths. On Windows Vista, Process Monitor also collects thread stacks for network operations.
Download here: https://technet.microsoft.com/en-us/sysinternals/bb896645.aspx
As before, Process Monitor includes:
- Monitoring of process and thread startup and exit, including exit status codes
- Monitoring of image (DLL and kernel-mode device driver) loads
- More data captured for operation input and output parameters
- Non-destructive filters allow you to set filters without losing data
- Capture of thread stacks for each operation make it possible in many cases to identify the root cause of an operation
- Reliable capture of process details, including image path, command line, user and session ID
- Configurable and moveable columns for any event property
- Filters can be set for any data field, including fields not configured as columns
- Advanced logging architecture scales to tens of millions of captured events and gigabytes of log data
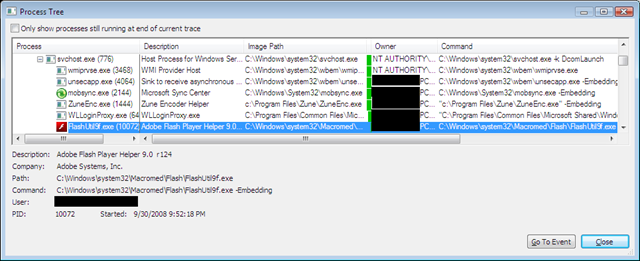
- Process tree tool shows relationship of all processes referenced in a trace
- Native log format preserves all data for loading in a different Process Monitor instance
- Process tooltip for easy viewing of process image information
- Detail tooltip allows convenient access to formatted data that doesn't fit in the column
- Cancellable search
- Boot time logging of all operations
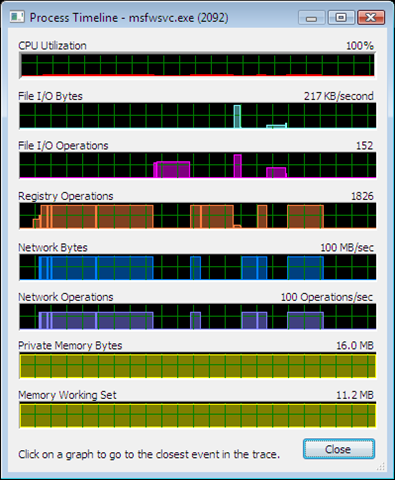
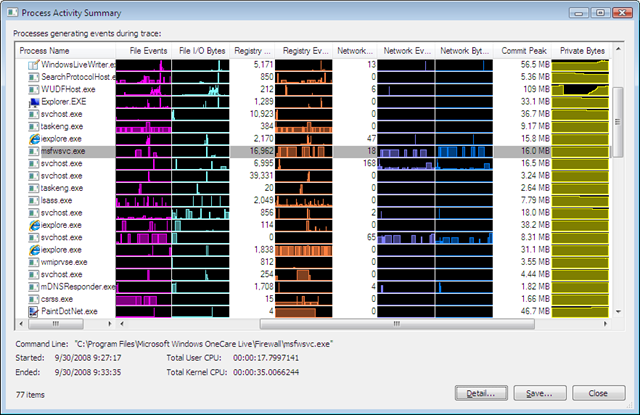
And now, for some screenshots to whet your appetite.