Hardware Inventory – In-Depth (Part 1)
This week I worked with a customer who asked me several in-depth questions related to Hardware Inventory. I thought it might be useful to put my findings into this blog entry for the benefit of others who might find them beneficial. I want to start by thanking my colleague Clint who took the time to walk me through much of this information…the time was truly appreciated!
Tracing Hardware Inventory
Every ConfigMgr admin knows that the best way to figure out what’s happening within their hierarchy is to review the extensive log files available to them. We’ll start this blog with a walk-through of the relevant log files for Hardware Inventory.
To start with, Hardware Inventory involves the client machine, its chosen Management Point, and the Site Server itself (and if the database is remote from the Site Server, the SQL Server is also involved to ensure that Hardware Inventory is put into the database). To walk through the process of conducting Hardware Inventory, we will take a look at the following logs:
- Client:
- InventoryAgent.log
- Management Point:
- MP_Hinv.log
- Site Server:
- Dataldr.log
NOTE: If your Management Point resides on your Site Server, both the MP_Hinv.log and Dataldr.log files will be on the same machine, though in different directories.
Before the client can ever begin to report its Hardware Inventory, it must receive a policy telling it to do so (and the frequency with which it’s expected to do so). Rather than repeat myself on how to configure Hardware Inventory for your clients in this blog, I’ll simply note that I discussed this in a previous blog and folks who are interested can review that information here.
To get policies, the CCM client will have to be installed on the client machine which can be confirmed by looking in the Admin Console under Assets and Compliance\Devices. Ideally we want to see the following:
Note here that the machine named ‘DC’ has the client installed and is marked as active.
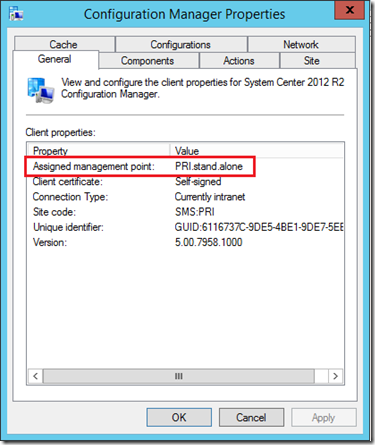
Once we have the client installed on the machine and it’s active (which means it’s sending in discovery information), the CCM client should receive policy from its chosen Management Point. If it’s necessary to know which MP the client is using, this can be determined by looking on the Configuration Management app in Control Panel as shown below:
In my lab there is only a single MP, so the question of which Management Point my clients are using is a pretty simple one to answer. But if the site contains multiple MPs and it’s important to know which one is being used, this is a good technique to determine that.
So now we have a client that is active and talking to its Management Point. This means it will get the policy telling it how often it needs to run Hardware Inventory (as well as what specific information it needs to gather and send). Once it receives the policy, the client will begin sending its Hardware Inventory and the log files should begin to reflect this.
Understanding Synchronization Types and Versioning
Each time a client sends in its Hardware Inventory, there are 3 possible ways it can do this:
- Full Synchronization – this occurs the very first time the client sends in its Hardware Inventory. At this point, no inventory has ever been reported and the client must send everything ConfigMgr has asked for.
- Delta Synchronization – once a full sync has been processed, the client will always run delta syncs from that point on. This causes the client to send up any changes since the previous sync, but doesn’t burden ConfigMgr with the entire inventory sent during a full sync
- Re-Synchronization – this happens if ConfigMgr can’t process the delta sync for some reason and needs the client to re-sync all of its hardware inventory. An example of when this might happen is if one of the delta syncs failed to be processed. Each sync specifies a version # so that ConfigMgr knows where in the sequence it belongs. We can think of delta syncs like pages in a book. The delta sync will send the next page, but if ConfigMgr does not have the previous page it will realize it has incomplete data and request the client to send everything it has. The process of doing this is known as a re-sync, though functionally it’s essentially the same thing as a full sync
It’s very easy to determine what sort of sync is happening. All that’s needed it to look in InventoryAgent.log on the client and search for a line similar to the following:
Inventory: Action=Hardware, ReportType=Delta, MajorVersion=1, MinorVersion=1
Note that this line tells us it’s about inventory and the Action specifies that we’re looking at hardware inventory. The ReportType shows that the client is performing a delta synchronization and we can see both the MajorVersion and MinorVersion are 1 in this case
To quickly clarify what is meant by MajorVersion and MinorVersion:
- MajorVersion – this value increments every time a full synchronization or a resync is run. As stated above, once the initial full synchronization occurs, all future syncs will be delta syncs unless there is a problem that causes ConfigMgr to ask for a resync. Note also that even if the specific policy for Hardware Inventory is changed (adding a new class to collect, for instance) the major version will not change. If you want to test this, there is a good link that walks you through forcing a full synchronization for hardware inventory. You can read about that here.
- MinorVersion – every time a delta sync runs, the minor version is incremented. The only exception to this is when a resync runs and increases the major version, the minor version is reset to zero as shown below:
Delta before Resync:
Delta after Resync:
In our example below, we’ll be looking at a delta sync. But it’s good to understand the specifics of what we’re looking at, so hopefully this explanation is helpful.
Log File Review
InventoryAgent.log
The first log we want to look at when tracing hardware inventory is the InventoryAgent.log file. Here, we can see several interesting details about hardware inventory. Because the amount of data provided to us in a single hardware inventory cycle can be lengthy, I am taking the liberty of excerpting information to draw out specific points.
Here we see the initiation of a hardware inventory cycle, which is denoted by the line saying ‘Start of message processing’. In this snippet, we can see several important things:
- The time that the inventory cycle started (this will be important later as we check to see how long it took inventory to run)
- The WMI store for the gathered hardware inventory (located in InventoryActionStatus class within the root\ccm\invagt namespace). In our case, we’re using store {00000000-0000-0000-0000-000000000001}
- The client is running hardware inventory (Action=Hardware)
- A full synchronization has only been run once, which is the initial time the client ran the inventory (MajorVersion=1)
- This is the 7th time a delta synchronization has run (MinorVersion=7)
- The classes being collected are enumerated, with two being listed in the screenshot above. Though the screenshot doesn’t show this, the fully query for the first line starting with ‘Collection: Namespace=’ is below:
Collection: Namespace = \\.\root\cimv2; Query = SELECT __CLASS, __PATH, __RELPATH, Availability, Caption, Description, DeviceID, Drive, Manufacturer, MediaType, Name, SCSITargetId, SystemName, VolumeName FROM Win32_CDROMDrive; Timeout = 60
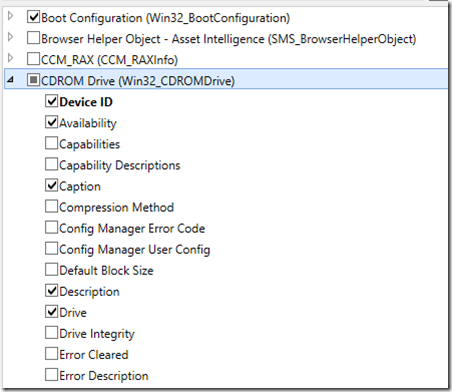
Note that Win32_CDROMDrive is in blue. This is the class being queried and we can see that this class was requested if we go into the Admin Console and navigate to Administration\Client Settings and open the Client Settings we are applying to our managed devices. By selecting Hardware Inventory from the list, look for the ‘Set Classes’ button and a pop-up will appear. In my lab machine, doing this shows me that I do include the Win32_CDROMDrive class as one of the classes I want to gather information on. The screenshot below illustrates this:
Not only is the class selected, but by expanding it I can see which specific attributes of the class are of interest to me.
At this point, the hardware inventory should run, gathering data from every class we’ve asked the client to check. During this process, it may encounter errors as it attempts to check a class that is not relevant for it. This is not indicative of a problem, though in some environments the choice may be made to set up additional Client Settings policies in order to gather inventory only from classes that are relevant to the managed device being targeted. The choice is entirely optional.
After inventory wraps up, InventoryAgent.log will show something like the following:
This snippet represents the end of the hardware inventory cycle and we can see a few interesting things:
- The ending timestamp, which tells us that on my lab machine, hardware inventory took approx. 25 seconds. Note that because hardware inventory is set to the lowest possible priority, it will likely take considerably longer to run in a production environment. This is because hardware inventory is set to use CPU cycles only when other activities are not ongoing.
- The temp report created (Temp report =)
- How long the Reporting Task took to complete (in our case 0.344 seconds)
- Whether the report was successfully sent or not (Successfully sent report. Destination:mp:MP_HinvEndpoint)
So we can see that the client ran inventory, how long it took, which classes it enumerated, and whether it sent its report successfully. At this point, we can have confidence that the client has done its part. Our next step is to check the MP to find out if it received what the client sent.
MP_Hinv.log
By looking on the Management Point (and if you have several MPs, you’ll need to locate the one your client is sending data to) and mapping the timestamp in InventoryAgent.log, we can see that MP_Hinv.log shows my client files arriving and being processed.
In this snippet, we see a few things:
- The report being sent in was a delta report and was from the computer PRI (Delta report from client PRI)
- The .xml file from the client arrived in dataldr.box and was found to be hardware inventory (description = Hardware)
- The .xml was converted to a .MIF file for sending further on to the site server database
- The name of the MIF file being created (in this case HC3HFXZ1.MIF)
At the Management Point, it’s possible for the hardware inventory to fail to be added to the database for some reason. One of the most common is known as a Nonexistent Row. This can happen when the following occurs:
- Delta synchronization happens on the client
- It sends the .xml reporting the MajorVersion and MinorVersion (in this example, let’s say MinorVersion=7)
- The site server database notes that it never received the delta synchronization with MinorVersion=6, thus it is missing a row that corresponds with the previous delta sync
- The client is told to send a fully synchronization (a re-sync)
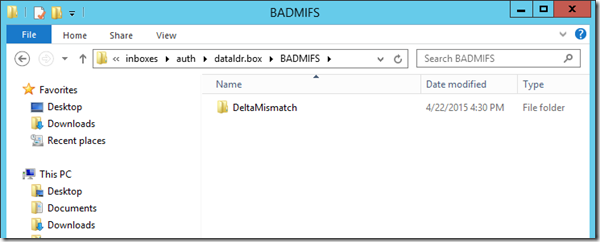
One of the interesting things about hardware inventory is how bad MIF files are categorized. Depending on the reason that a MIF is rejected (as in the Nonexistent Row example), a folder will be created on the MP within the inboxes\auth\dataldr.box\BADMIFS folder structure. The screenshot below from my lab shows a sub-folder that was created when one of my clients began presenting bad MIF files. If MIFs cannot be processed for a different reason and must be placed in this folder structure, additional sub-folders will be created to indicate why the MIF was not processed.
Within this folder will be the MIFs that were rejected, and it’s often helpful to review them (you can open them with notepad) to see the reason for the problem. For further information about BADMIFs errors, a very helpful blog article by Umair Khan goes into some depth. That article can be found here.
Dataldr.log
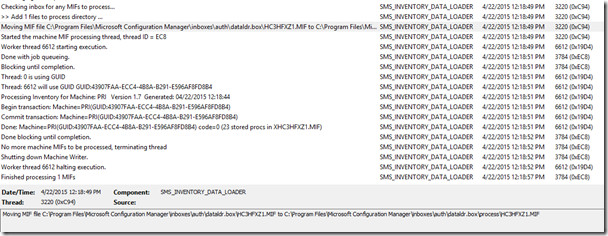
In our case, there was no error when submitting hardware inventory, so the next place to look is the Dataldr.log file. As I mentioned above, this file is located on the site server itself even if the MP is on another machine. The following snippet shows the next step in the process of submitting hardware inventory:
Note that in the snippet above, I have highlighted the line starting with “Moving MIF file”. The full content for that line is listed in the gray window at the bottom of the screenshot.
Looking at this, we can see a number of interesting things:
- At 12:18:49, Data Loader checked to see if any MIFs needed to be processed. It found one and moved it to the dataldr.box\process subfolder
- It started a worker thread and indicates “Blocking until completion”. This indicates that the table or tables in the ConfigMgr database that are being updated have been reserved exclusively for this process. Anything else attempting to update this table during this interval will have to wait its turn
- Blocking is a very common concept in SQL. Sometimes it can be a problem, but in this case blocking is quite normal. If you are interested in further information about blocking, you can check out this link.
- We can see that the version of hardware inventory being processed is 1.7 and when it was generated. Version 1.7 directly maps to the MajorVersion and MinorVersion that we discussed above. In this case, it’s MajorVersion=1 and MinorVersion=7
- We see the process of adding the inventory information to the database starting (Begin transaction), successfully committing the information (Commit transaction), and then we see it remove the block from the database table (Don blocking until completion)
- We see that no more MIFs need to be processed, and finally we see that Dataldr indicates it’s done processing the MIF
Locating Hardware Inventory in the ConfigMgr Database
At this point, we have a complete chain from the client all the way to the database itself. As to which table is updated, there are many different tables that contain the hardware inventory data. Everything is not deposited into one table, but is distributed based on the information provided. The following is an example of how we can locate the information on the processor being used by our test machine.
NOTE: The following information is offered to help in understanding this process. You should never make changes in your database unless guided to do so by a Microsoft engineer. Always back up your SQL database and ensure it is recoverable before making any changes to it.
To start with, we need to find the Machine ID for our client. To do this, we can run the following query against the system_DISC table in the ConfigMgr database:
select ItemKey, Name0 from system_DISC where Name0 = ‘ <computer name>’
In our case, the computer name is ‘PRI’ so we end up with the following result:
As it happens, the ItemKey value in system_DISC is the Machine ID we will need when checking the other tables to find out our Processor information.
Now that we have this, we need to find the table where the Processor information is held. In ConfigMgr, there is a table known as Groupmap that identifies the tables where we can locate our desired information. By running the following query, we can locate the table we’re interested in:
select * from dbo.groupmap where SpecificTableName like '%Processor%';
Running this, we get the following result:
Note that the specific table name is Processor_DATA. Now that we have this, we can query it for our information. The following query will get us what we need:
select MachineID, TimeKey, Manufacturer00, Name00 from Processor_DATA where MachineID = ' <MachineID> ';
At this point, we will need to enter the ItemKey value from the system_DISC query since this value is the MachineID of our client and will allow us to bring up the information we care about. Doing this generates the following result:
I have selected only a couple of columns here and certainly more are available. But what we can see from my chosen query is:
- The MachineID that maps to our chosen client (PRI, in this case)
- The TimeKey indicating when this information was successfully added to the database
- The manufacturer and name of the processor this client machine is using
As I say, this information is good to know. But you should never dig around in the database or make modifications to it unless there is an important reason to do so. And if you’re going to make a change, wait for someone from Microsoft to give you direction before you do (and ALWAYS make sure you have a verified healthy backup before you do anything).
Using Resource Explorer
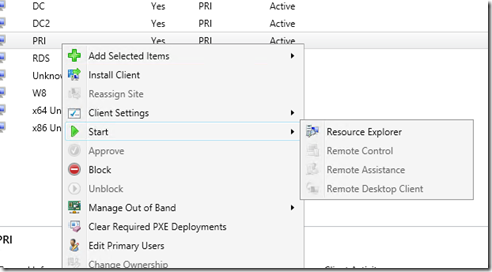
So is there a better way to get this information than going to the database? The answer is ‘yes’. ConfigMgr provides a very robust (and safer) method to gather hardware information for any managed device. To get the information we need, all we have to do is nagivate in the Admin Console to Assets and Compliance\Devices and select the client we are interested in.
Right-click the managed device and choose Start\Resource Explorer as shown below:
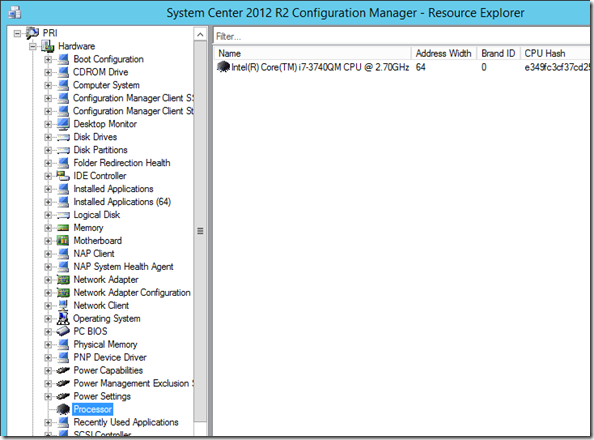
By opening Resource Explorer, we can se a consolidated list of all the hardware inventory information gathered about this client. Below, I’ve chosen to look up the processor information (the same information we looked for in the database above). As we can see, we get the same information:
The moral of the story is that we never need to look in the database itself for hardware inventory information. It’s nice to know it’s there. But ConfigMgr gives us a way to see all of this information from the Admin Console and that’s how we should be doing it.
Summary
In this blog (which will be the first of two parts), I have walked through the process of tracing hardware inventory from a client, through its Management Point, and finally shown the inventory being added to the ConfigMgr database on the site server. Hardware inventory is a very important component of what ConfigMgr does and understanding this process is important for engineers tasked with running a healthy infrastructure.
In the next part of this series, I’ll talk about how we can learn (and configure) when hardware inventory will run. Much of the confusion around hardware inventory deals with a lack of information on when clients should run and will run inventory. I hope to clear this up a bit, and also provide some guidance to those who might need to customize how hardware inventory is processed in their environment.

