What happens behind the scenes when using the Microsoft Support Diagnostic Tool
[Today’s post comes to us courtesy of Damian Leibaschoff from Commercial Technical Support]
The Microsoft Support Diagnostic Tool allows you to collect and send information about your computer to Microsoft Support as part of a support request (more info on MSDT). When opening a new support incident, you should receive an email similar to this:
Dear Customer,
Thank you for contacting Microsoft; we appreciate your continued business and the opportunity to assist you with your inquiry. Your Service Request nnnnnnnnnnnnnnn has been created and is being routed to the appropriate Support Engineer at this time. You will be contacted by an assigned Engineer regarding this Service Request.
To allow us to better support your Service Request, we strongly recommend that you run the provided Diagnostic Data Collector which will provide Microsoft with additional information about your issue.
From the computer which is having the problem related to this SR and is connected to the internet:
- Please click the web link below or copy and paste the HTTP line below into your Internet browser's address bar and follow the provided prompts. This will enable Microsoft to collect information pertinent to your request.
NOTE: The link below expires on nn/nn/nnnn.
https://support.microsoft.com/Dcode/Default.aspx?guid=111111111111111111111
Thank you,
Microsoft Commercial Technical Support
If you don’t receive this email, ask the support engineer working your case to send you a Data Collection Request. If you do get the email, try to complete the collection and upload as soon as possible, even before talking to the support engineer as it will potentially help resolve your case faster.
Let’s focus on the brand new SBS 2008 collection and diagnostics package that was introduced in September 2010 and share what is going on behind the scenes. The first thing to note is that there is much more than just data collection, there is also a great deal of automated analysis taking place. Furthermore all of these logs and reports are uploaded and presented to not only the support engineer working your case, but also technical leads, subject matter experts and technical mentors, creating a single, easy to access repository, with the most relevant data to help get the fastest possible resolution to the current issue.
This is a high level overview of what is collected and analyzed:
- Subset of key Setup, Performance, Directory Services and Networking logs and output
- Collects event logs for the last n days (All, 5, 14, 30)
- MsInfo32 Output (nfo and txt)
- Sysinternal’s Autoruns Output
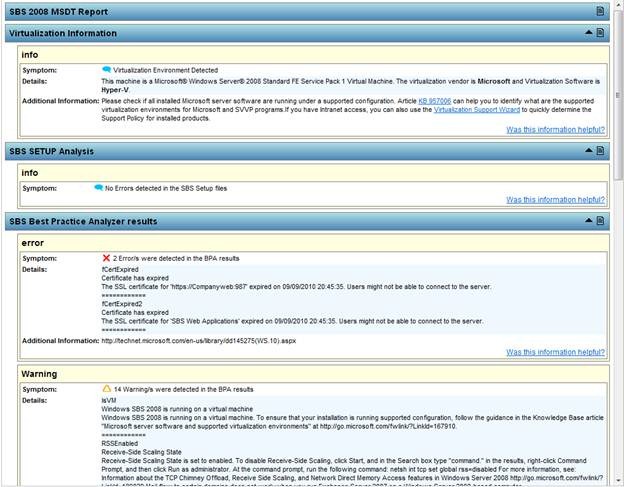
- Collects and Analyzes SBS Setup logs against known issues, displays them in main report page.
- Extract SBS Setup errors
- Deploys (if not present), updates (if needed) and runs the SBS 2008 BPA.
- Processes results from the BPA and displays them in main results page.
- Collects SBS logs, including the last day of IIS logs for SBS web sites.
- HTML Formatted output for:
- Autoruns
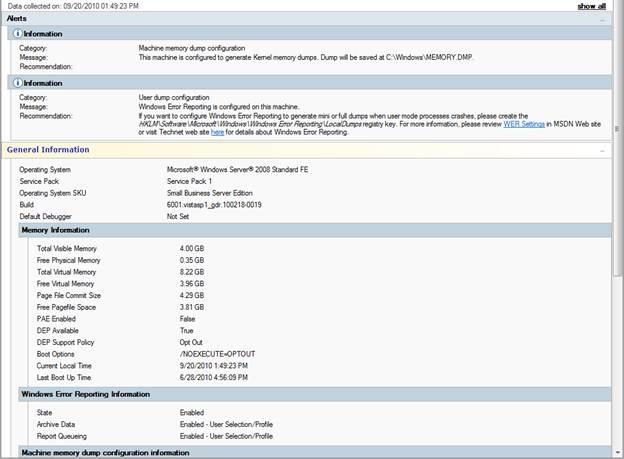
- Dump configuration and presence report
- GpResult
- Hotfixes/Updates
- Print Subsystem report
- System Performance report
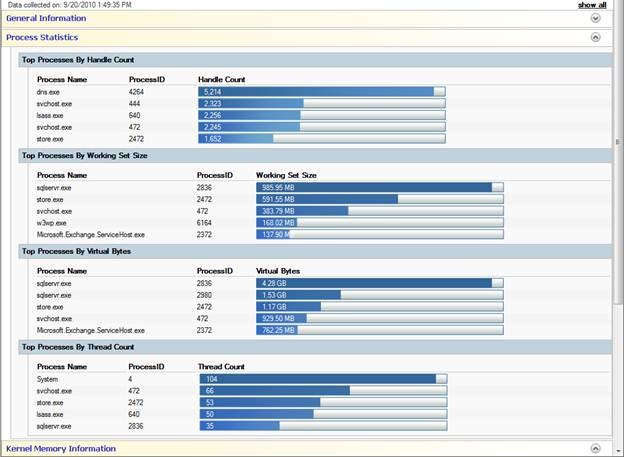
- Performance information for top processes
- RSOP Report
- Virtualization Report
If you want to read more about the data collection, check:
2414539 [SDP 2][BD3BAB8D-1593-4864-9363-36B61D032F5B] Windows Small Business Server 2008 All-purpose data collection and analysis
https://support.microsoft.com/default.aspx?scid=kb;en-US;2414539
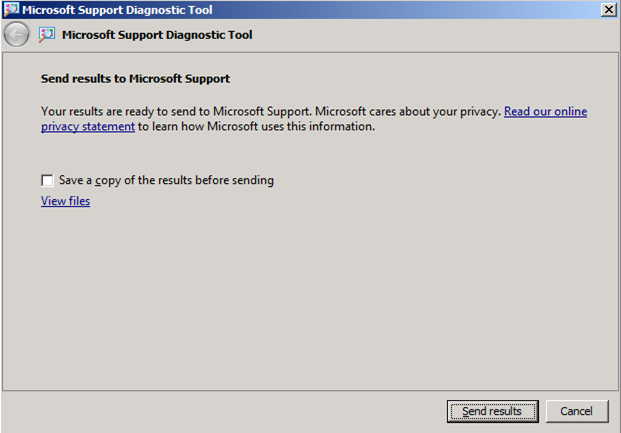
If you want to take a peek at the data collected and some of the reports before they are uploaded, you can view them by either saving the files locally or viewing the files. You can access these options right before sending the results on the last page of the MSDT wizard.
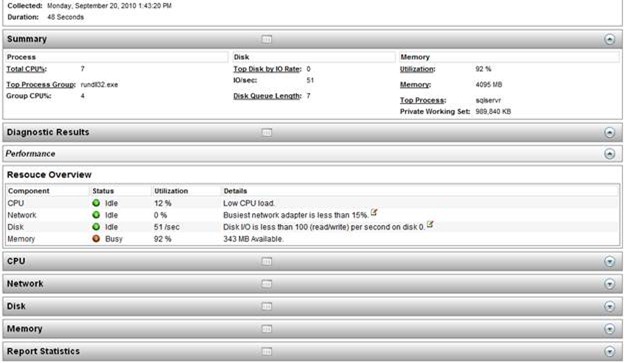
Below are some examples of the reports generated by the SBS 2008 MSDT manifest:
