Customize Bar chart using Open XML in MVC application
Open XML is a Microsoft library to manipulate Office documents like Word, Excel, PowerPoint programmatically and can be downloaded from here. It’s also a document format which consists of XML parts in ZIP package representing Word (WordprocessingML), Excel (SpreadsheetML), PowerPoint (PresentationML).
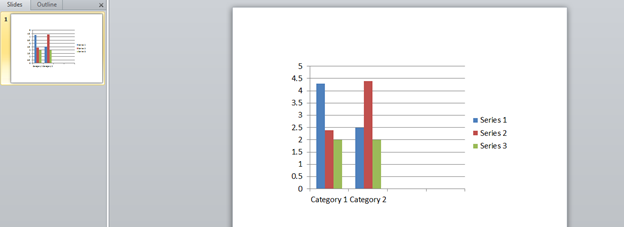
In this article, we will be looking into customization of a Bar chart in PowerPoint using Open XML library within ASP.NET MVC application. Create a new MVC 3 Internet application on VS 2010 and name it as PPTBarChart. Add a reference to DocumentFormat.OpenXml.dll, WindowsBase.dll [Download from here]. Create a PowerPoint 2007/2010 with bar chart having two categories under Content folder as shown below:
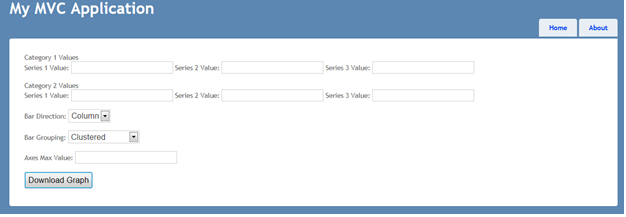
Modify Index view as shown below to enter values for customizing the bar chart’s values, Maximum, Direction & Grouping etc:
Include below namespaces in the HomeController:
using DocumentFormat.OpenXml;
using DocumentFormat.OpenXml.Presentation;
using DocumentFormat.OpenXml.Packaging;
using DocumentFormat.OpenXml.Drawing.Charts;
Create below POST action to read the PowerPoint, replace the chart’s value and send it to client for download as shown below:
[HttpPost] public ActionResult Index(FormCollection form) { //Read PPT in-memory for inline editing byte[] byteArrayPPT = System.IO.File.ReadAllBytes(Server.MapPath(@"~\content\BarGraphPPT.pptx")); MemoryStream FPmem = new MemoryStream(); FPmem.Write(byteArrayPPT, 0, (int)byteArrayPPT.Length); PresentationDocument barPPT = PresentationDocument.Open(FPmem, true); // Get the chart in the first slide ChartPart chartPart = barPPT.PresentationPart.SlideParts.First().ChartParts.First(); ChartSpace chartSpace = chartPart.ChartSpace; List<int> indexOfUsedItems = new List<int>(); BarChart barChart = chartSpace.Descendants<BarChart>().FirstOrDefault(); //Set Max Value for Y Axis: if (((DocumentFormat.OpenXml.Drawing.Charts.MaxAxisValue)chartPart.ChartSpace.Descendants<DocumentFormat.OpenXml.Drawing.Charts.MaxAxisValue>().FirstOrDefault()) != null) { ((DocumentFormat.OpenXml.Drawing.Charts.MaxAxisValue)chartPart.ChartSpace.Descendants<DocumentFormat.OpenXml.Drawing.Charts.MaxAxisValue>().FirstOrDefault()).Val.Value = Convert.ToInt32(Request.Form["MaxValue"]); } //Set Bar Direction: if (form["BarDirection"] == "Column") { barChart.BarDirection = new BarDirection() { Val = BarDirectionValues.Column }; } else if (form["BarDirection"] == "Bar") { barChart.BarDirection = new BarDirection() { Val = BarDirectionValues.Bar }; } //Set Bar Grouping: if (form["BarGroup"] == "Clustered") { barChart.BarGrouping = new BarGrouping() { Val = BarGroupingValues.Clustered }; } else if (form["BarGroup"] == "Stacked") { barChart.BarGrouping = new BarGrouping() { Val = BarGroupingValues.Stacked }; } else if (form["BarGroup"] == "PercentStacked") { barChart.BarGrouping = new BarGrouping() { Val = BarGroupingValues.PercentStacked }; } else if (form["BarGroup"] == "Standard") { barChart.BarGrouping = new BarGrouping() { Val = BarGroupingValues.Standard }; } //Set Bar's Value: if(!String.IsNullOrEmpty(form["Series11Value"].ToString())) barChart.Descendants<NumericPoint>().ElementAt(0).NumericValue = new NumericValue(form["Series11Value"].ToString()); if (!String.IsNullOrEmpty(form["Series21Value"].ToString())) barChart.Descendants<NumericPoint>().ElementAt(1).NumericValue = new NumericValue(form["Series21Value"].ToString()); if (!String.IsNullOrEmpty(form["Series12Value"].ToString())) barChart.Descendants<NumericPoint>().ElementAt(2).NumericValue = new NumericValue(form["Series12Value"].ToString()); if (!String.IsNullOrEmpty(form["Series22Value"].ToString())) barChart.Descendants<NumericPoint>().ElementAt(3).NumericValue = new NumericValue(form["Series22Value"].ToString()); if (!String.IsNullOrEmpty(form["Series31Value"].ToString())) barChart.Descendants<NumericPoint>().ElementAt(4).NumericValue = new NumericValue(form["Series31Value"].ToString()); if (!String.IsNullOrEmpty(form["Series32Value"].ToString())) barChart.Descendants<NumericPoint>().ElementAt(5).NumericValue = new NumericValue(form["Series32Value"].ToString()); barPPT.PresentationPart.Presentation.Save(); barPPT.Close(); string fileName = Server.MapPath(@"~\content\"+Guid.NewGuid().ToString()+".pptx"); using (FileStream fileStream = new FileStream(fileName, System.IO.FileMode.Create)) { FPmem.WriteTo(fileStream); FPmem.Flush(); FPmem.Close(); } return File(fileName, "application/mspowerpoint", "BarGraphPPT.pptx"); }
Let’s dig into above code:
1) We read the PPT content into Memory for in-line editing. This will avoid the changes to be written onto original file [BarGraphPPT.pptx].
2) Find the first chart on the first slide and set its Maximum Y Axis value.
3) Similar way, we are setting other values retrieved from the view like bar direction, Group and Category’s values.
4) We are saving all the changes of the in-memory PPT and written to a file.
5) Finally, we are returning the file back to client for download.
We can run the application and customize the properties of the Bar chart and click on "Download Graph" to download the PowerPoint. By tweaking the above code, we can customize any kind & number of graphs within a PowerPoint. I hope this article will be helpful.