Look at Internet Explorer 9 Developer Tools
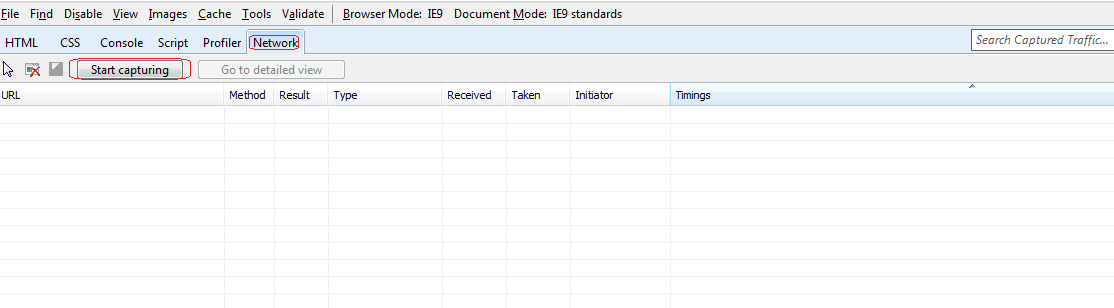
In this Blog, We will look into Developer Tools for Internet Explorer 9 that helps Web developer to debug/troubleshoot issues. Our focus will be mainly on network tab in it, which will help to see request & response headers, cookies, body Initiator and Timings etc. To analyze request/response headers & body or capture a network trace in previous versions of Internet Explorer, We need external tools like Fiddler. But, in IE 9 we have built-in component inside Developer Tools to capture a trace and analyze it. We can show/hide Developer Tools from Tools menu -> F12 Developer Tools or using F12 key. By default, Network capture is disabled as shown below:
Click on Start Capturing and open a website like bing.com. It will capture network traffic as shown below:
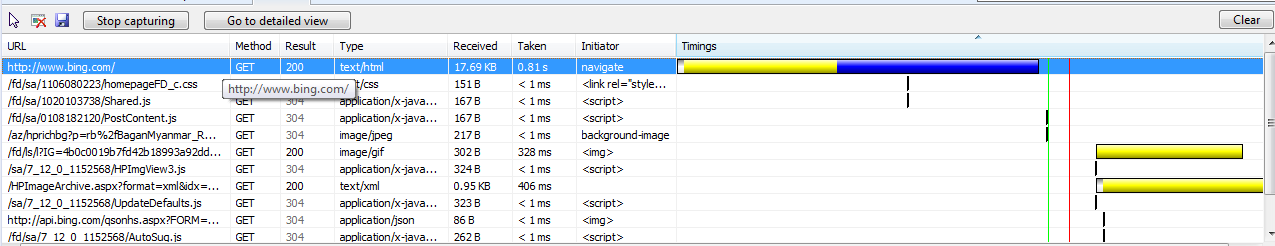
Initiator for a request shows who initiated that request. In above capture, it shows download/request for homepageFD_c.css is initiated by link tag referring it.
We can double-click on any of the request to see more details of it like header, body and cookies as shown below:
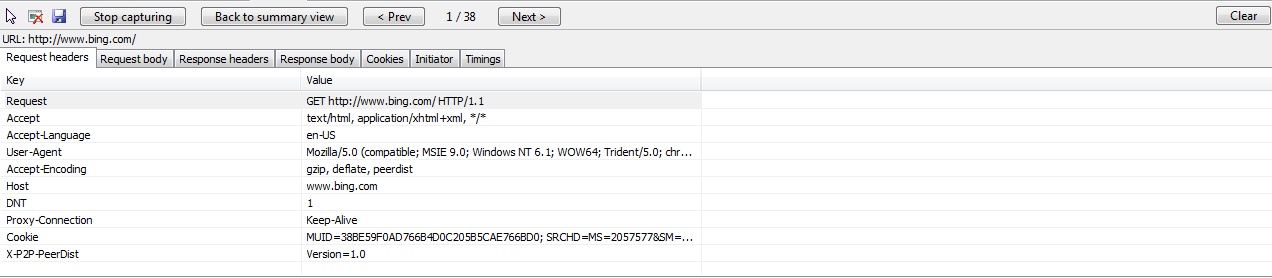
We can save the network trace in xml or csv format for further analysis.
Some other cool features are:
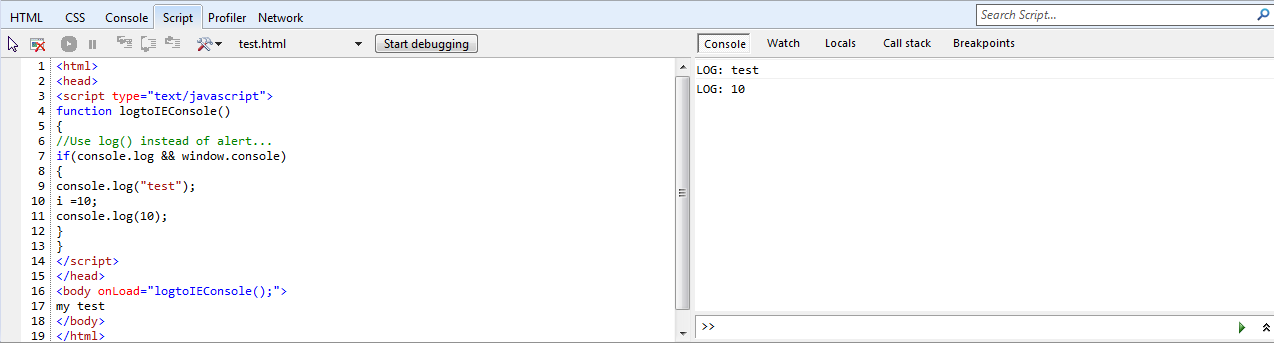
1) We can use logging API instead of alert() for debugging using console.log() method as shown below:
2) We can debug client side javascript, add conditional breakpoints similar to Visual Studio breakpoints.
3) Profiler shows the amount of time scripts took to execute functions. This data can be viewed either in Function view or Call tree view.
There are lot more features apart from the ones covered here.