How To: Use a PowerBI template to analyze Event Logs exported as a CSV file
Prerequisites/Ingredients
- PowerBI Desktop – You can download it here
- The PowerBI Event Log analysis template - You can download it here - it is a .PBIT format, you'll have to unzip it.
- Windows Powershell (from 2.0 – Windows 2008/2008R2 up to 5.2- Windows 2016)
or Powershell 6 (https://github.com/PowerShell/PowerShell/releases) - The Get-EventsFromEventLogs.ps1 PowerShell script – You can download it here
Before loading the PowerBI template I made for you, you must have a CSV collected with the Get-EventsFromEventLogs.ps1 script. See the following sections…
Collect your events using the Get-EventsFromEventLogs script
Collect the events from your servers using the Get-EventsFromEventLogs.ps1 script, preferably using the following parameters – just replace the Server01, Server02 with your computers, or the content of a Computers.txt file:
.\Get-EventsFromEventLogs.ps1 -Computers Server01,Server02 -EventLevel Warning,Error,Critical -NumberOfLastEventsToGet 200 –ExportToFile
Note: to get the computers list from a text file use the following syntax just after the -Computers parameter :
-Computers $(Get-Content C:\temp\Computers.txt)
The exported CSV file will be located on the same directory where you placed your Get-EventsFromEventLogs.ps1 script, and will be named like "GetEventsFromEventLogs_blabla-Date-Time.csv"
Get the PowerBI template
The template created to work with the file exported with the Get-EventsFromEventLogs.ps1 script is named :
Event_Dump_Analysis_Template.pbit
See the prerequisites above for the download link - I'm placing here for convenience in case you forgot to go through the prerequisites.
Open the PowerBI Template (PBIT) and point it to your CSV Events file
NOTE: you will need the CSV file that was generated by the Get-EventsFromEventLogs.ps1 script introduced on section 2 above…
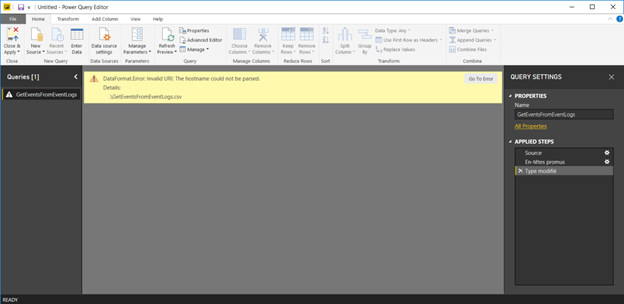
Open it -> you will have an error just after PowerBI Desktop loaded => it is expected because we didn't specify the GetEventsFromEventLogs-xxxx-xxxx-xxx.CSV file to analyze yet ! It's coming on next step.
Here's the expected error you'll get because at this point we didn't load our correct CSV file (I had to put a dummy value on the "URI" field to create the template because PowerBI doesn't have the functionality to request a CSV file prior to load the template for now):
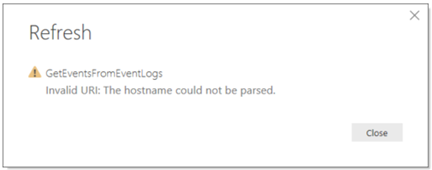
Click "Close" -> you'll see the first page of the report with blank values (because you didn't load your CSV yet !):
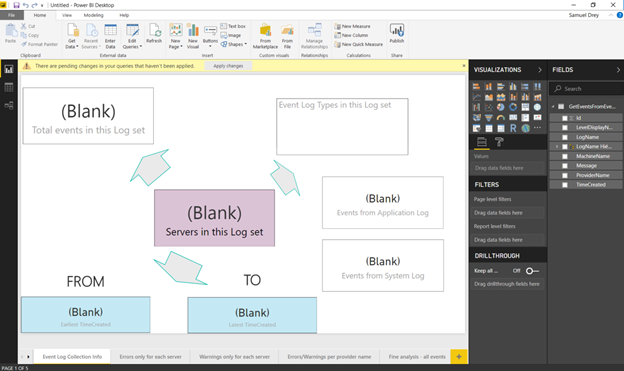
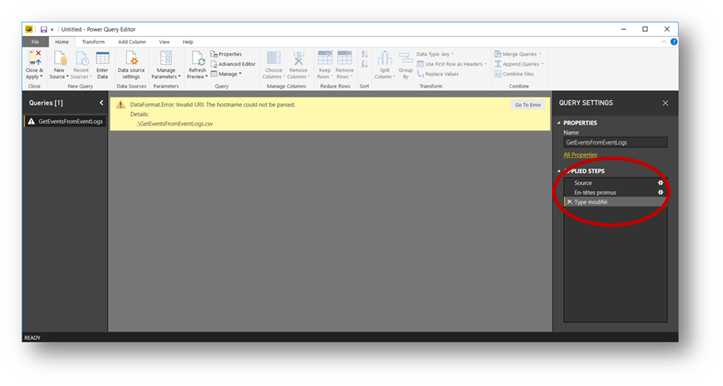
Click on "Edit Queries" button – I'm highlighting the button below so that you can't miss it :
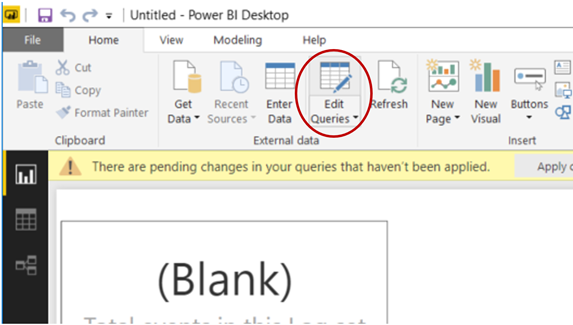
This will open the "Power Query Editor" window:
See the "APPLIED STEPS" on the far right of the screen above? Here's a closeup of it:
And a bit closer:
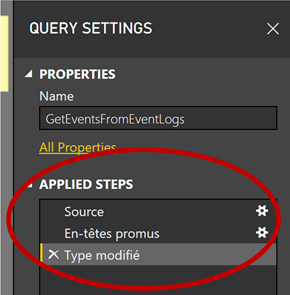
There is an entry in the list called "Source" with a configuration gear beneath it
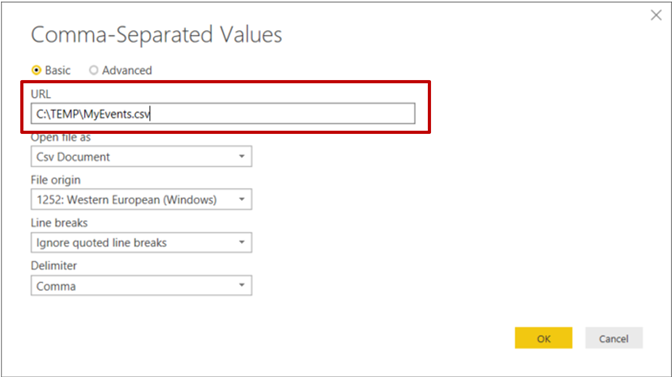
 -> click on the configuration gear of the "Source" entry, which will lead you there:
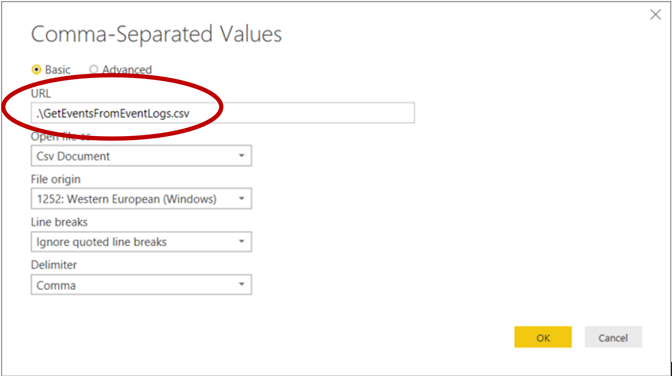
Closeup of the field we'll need to change:
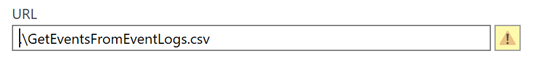
See the value you see in "URL" (default is .\GetEventsFromEventLog.csv, which is purposely invalid) => Change it to the path to the CSV file generated by your Get-ExchangeFromEventLogs.ps1 script – here I'll take my CSV file located in my C:\TEMP\ directory, and which I renamed MyEvents.CSV – I'll then specify in the "URL" field "C:\TEMP\MyEvents.CSV" – This is an example, just put your actual full CSV path and file name :
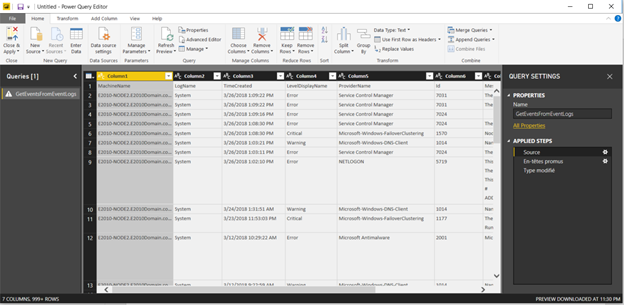
Click "OK" -> you should see the first elements of your CSV on the "Power Query Editor" window:
And click on the "Close and Apply" button on the upper left corner of the "Home" ribbon menu:
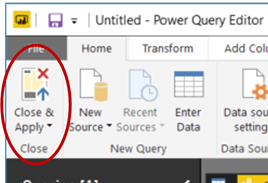
And Magic Happens ! Your PowerBI report will be filled with the stats from your collected CSV !
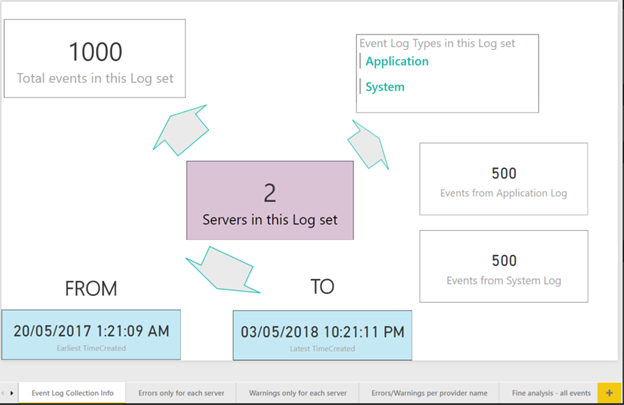
Navigate to the other tabs to see your events stats, click on the bars and/or on the servers to see the information filtered dynamically.
-------------------------- EXAMPLE 1 --------------------------
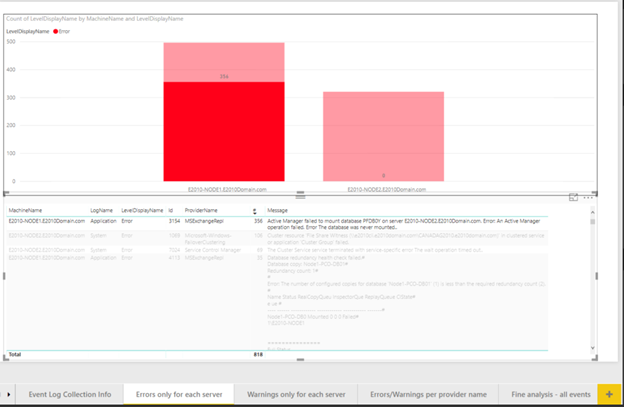
The "Errors only for each server" tab:
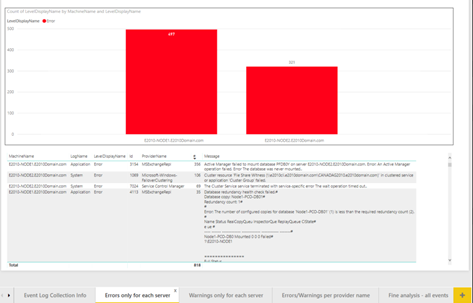
Click on the first bar (you'll see 1 bar per server – if you have 40 servers, you'll see 40 bars showing the number of Event Logs errors per server), and see the below table filtering dynamically to the error events that belong to that server only :
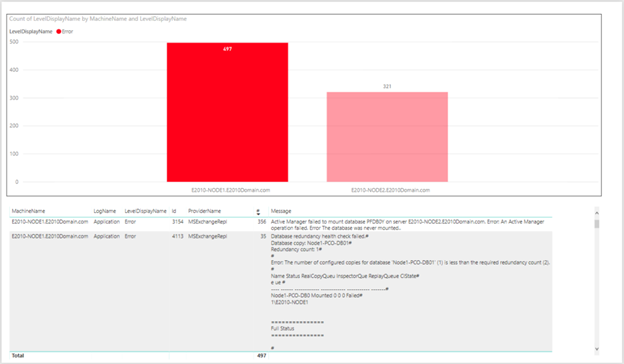
Same principle if you click an event in the below table, for example the first line that has 356 errors for my MSExchangeRepl service, it will show on which server these are distributed :
-------------------------- EXAMPLE 2 --------------------------
Let's see the "Errors/Warnings per provider name" tab :
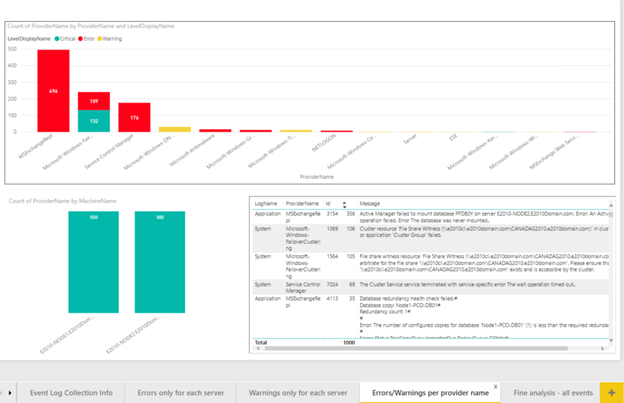
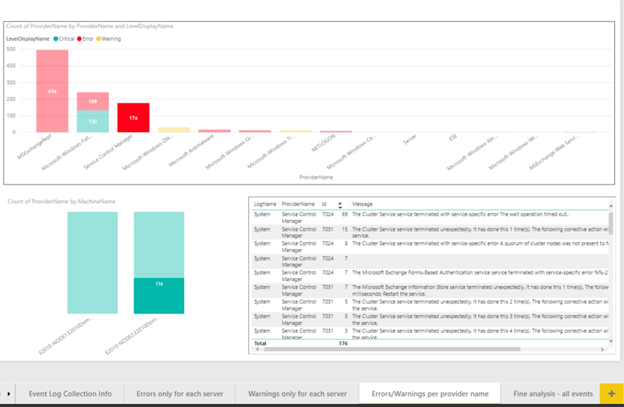
Here I have all the Errors and Warnings filtered in this page, shown by "Event Source" aka "Provider Name" (I should have renamed it). Same here, you can click either on one event on the below table to see the distribution per server or like the example below, on one of the category for which you'd like to see the errors and which server has this event – below I clicked on "Service control manager"
-------------------------- EXAMPLE 3 --------------------------
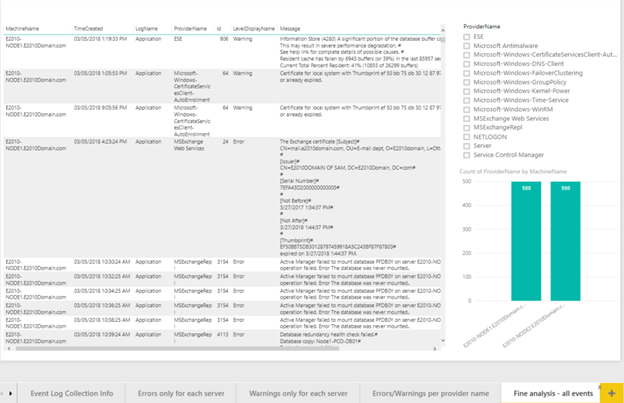
Finally, you can dig a bit more and check for the details of event logs with the last tab "Fine analysis – All events" – you can select a "ProviderName" aka "Event Source", or a server (one of the two bars below), or an event, and see what it does – below is the table before clicking on a "ProviderName":
And below the table after clicking on the "ESE" Provider Name aka Event Source:
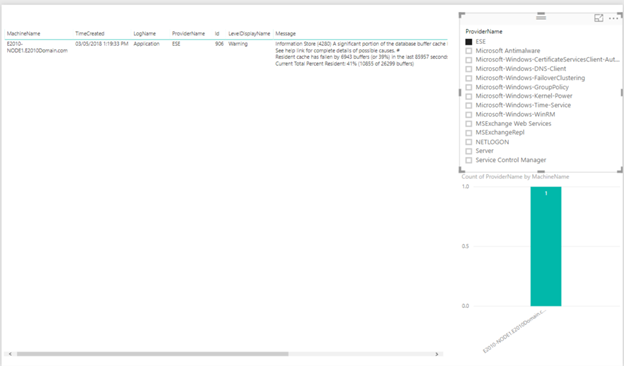
You see I have this event on only 1 of my servers (1 bar show up when I click on "ESE") …
Have fun !
Cheers
Sam