MSExchange RPCCLientAccess / MSExchangeIS –> RPC Averaged Latency – it’s always in milliseconds, not in seconds
Here I’ll just show a few examples just to make it sure if you have a doubt, that RPC Averaged Latency counter(s) is/are in milliseconds always, not in seconds, whether you query the counter(s) via Perfmon or Powershell (get-counter).
Perfmon in general always shows latency or times counters in milliseconds, usually in the format “0.000” for the Latest, Maximum, Average and Minimum values.
Here are a few examples.
I will do 2 sets of verifications to prove that the value we see for the RPC Averaged Latency (MSExchange RPC Client Access counter set) is in milliseconds even if it’s in the format “0.000”.
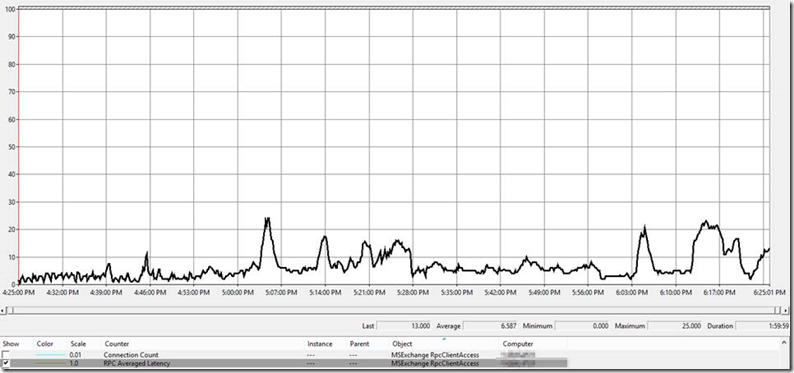
So first one, for two of my recent Exchange 2010 customers, I did a performance health check, and during the time frame of the test (2 hours), we had very few users, and we were good on RPC latencies (that is, below the 250ms error threshold for MSExchange RPCClientAccess – for MSExchangeIS, the error threshold is 100ms in average in Exchange 2010/2013).
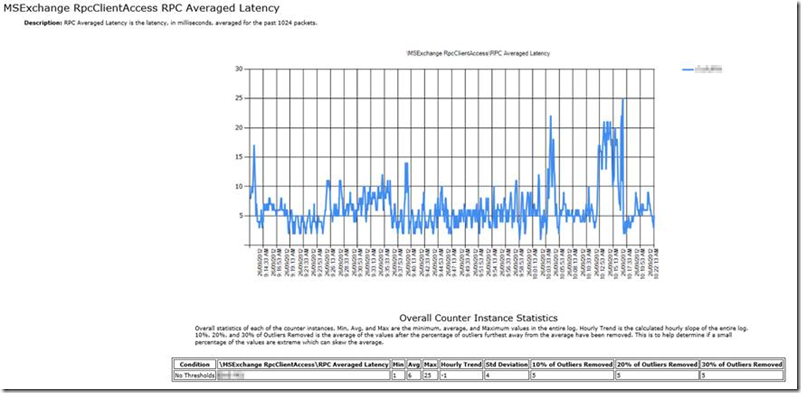
So first one, we have a spike of “25.000” and an average of “6.587” … so if it were in seconds, we would have had a spike at “25.000 seconds” (that is 25,000 milliseconds) and an average of “6.587 seconds” (that is 6,587 milliseconds – six thousands five hundred and eighty seven milliseconds)… over an error threshold of 250ms (0.250 seconds) … then if we assume these values were really in seconds, for this first customer, the Exchange server would have been unusable ! and it was not the case, we were all good - so on this case, it’s definitely 25.000 milliseconds for the spike, and 6.587 milliseconds for the average.
And another view generated by PAL (Performance Analyzer of Logs by Clint Huffman):
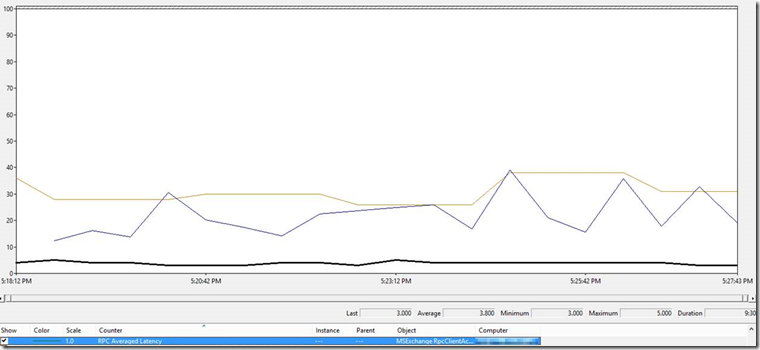
For the second one, a customer for which I’m dedicated, which was measured with just about 30 users on it (my test mailbox also was in as well), so very few load – you see a spike at “5.000” and an average of “3.800” – again if it were in seconds, it would be 5 seconds for the spike (=5000 milliseconds) , and 3.800 seconds (=3800 milliseconds) – wayyy above the 250ms error threshold again and if it was the case, we would be unresponsive on the client side, and even the Exchange server would definitely have a problem - so it’s 5.000 milliseconds for the spike, and 3.800 milliseconds for the average.
See below the performance show which shows in thick the RPC latency (MSExchange RPCClientAccess), the Active User Count in brown (again MSExchange RPCClientAccess list set), and in blue (or thin black) the RPC Operations/sec activity which was very low (usually a full loaded server with 5000 mailboxes shows about 2000 RPC operations per seconds – here we only had 25 RPC ops/sec in average:
And a final test on my own lab:
And from the test I just did on my Lab (the red line is the CPU work – the black one is the RPC Average Latency, which I have very few here) :
Average = 0.330 , Max 1.000
And the Outlook latencies on the client side show 3ms max for the Exchange Mail connection:
(the 72ms is for the “Exchange Directory” connection which is slow because I’m running 4 vms on my Laptop – 1 Exchange 2007 + GC, 1 Exchange 2010 + GC, 2 Exchange 2013 configured as a DAG, all these on 2 AD sites) – and in Outlook 2010/Exchange 2010, there is no direct connection to the GC for directory requests (Outlook 2010 connects to Exchange 2010, which does NSPI requests for client directory requests – that adds overall time and raises the “Exchange Directory” times you see on the “Connection Status” window)
But see, “Avg Resp” is always in ms on the “Connection status” otherwise if it were 3 seconds here, my Outlook client will be unresponsive and always freezing, which is definitely not the case – as we recommend a round-trip time from Outlook to Exchange of 110ms max otherwise we will see lots of freezing, and RPC “waiting for server” dialog boxes.
So that corresponds to the 1.000 ms spike I see on my server (if I had 1.000 sec spike on the server, I wouldn’t have 3 ms of “Avg Resp” time seen on the client but a value closer to 1000ms).
So in conclusion, the value we see in MSExchange RPCClientAccess is in milliseconds, and more generally, all values you’ll see on Perfmon counters for Exchange and AD latencies are in milliseconds just like Technet’s latency thresholds.
Sam.


