Idea–Process to use to analyze performance issues using Excel (provided you captured performance data with PERFMON configured to use CSV mode–or use tools like relog or logman to convert BLG to CSV)
Prerequisites :
- Collect performance data using the updated Exchange 2003 Perfwiz from Mike Lagase, or the ExPerfWiz for Exchange 2007 or 2010, from Mike Lagase again
- Then, either prior to the data collection start, modify the destination format of Perfmon logs from BLG to CSV using Perfmon to edit the counters collection created by ExPerfWiz, or after the data have been collected, use the RELOG tool to convert the BLG files to CSV files, very easy and straightforward, like “relog logfile.blg -f csv -o logfile.csv” (as we are going to use Excel to analyze the log files)
I- Identify, colorize, isolate the counters showing any latencies on your server
(e.g. RPC Average Latency from MSExchangeIS Mailbox, from MSExchangeIS Client (*), as well as RPC Average**d** latency from MSExchangeIS …)
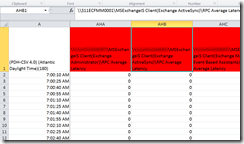
Format the cells that contain the “Latency” keyword in the headers to show in a colour (Red in my example)
You can copy all the “Latency” columns to an other Excel TAB, that will make the graph generation , the reading and the reporting easier.
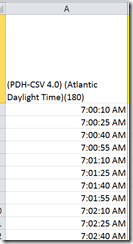
To make is easier to read, also make sure you copy the first column of the performance log, which is the timeline column.
II- Identify, colorize, isolate the counters showing users statistics on your server
(e.g. User Count, Active User Count, Connection count, Active Connection Count for MSExchangeIS and RPCClientAccess)
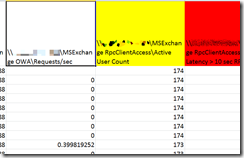
Format the cells that contain the “Count” keyword in the headers to show in an other colour (yellow in my example)
Again, you can copy and paste these identified columns on a separate TAB along with the time column to easier create the graph, and have a more efficient analysis.
III- Identify, colorize, isolate the counters showing the RPC operations done every second ...
(e.g. RPC Operations/sec from MSExchangeIS Client (*), from MSExchange RPCClientAccess …)
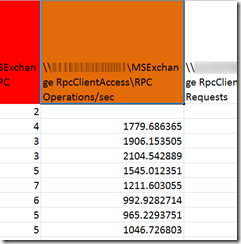
Format the cells that contain the “RPC Operations” keyword in the headers to show in an other colour (brown in my example)
Again, you can copy and paste these identified columns on a separate TAB along with the time column to easier create the graph, and have a more efficient analysis.
IV – Primary analysis and next steps
A first basic analysis will confirm whether or not your Exchange server is too slow, causing Outlook client experience issues (RPC dialog box, client freezing, slow Outlook opening times, …)
-> The second step is to check the User count and the number of RPC Operations per second to see if there is no unusual activity.
If everything is normal regarding the number of users and the number of RPC Operations, i.e. inside the metrics you planned when you sized your server, then the issue is likely caused by an external factor such as
- an application causing a memory leak on the server,
- or disks that are consuming lots of IOPS for an other application,
- or an other application or process that is CPU intensive,
- or also networking issues due to a poor network, a misconfigured NIC or an out-dated NIC driver or firmware,
- or GCs overloaded preventing Exchange to answer client RPC requests in a timely manner,
- or even an issue with the E-mail Antivirus that slows down the store processes, extending the answers to RPC requests (seen last year)
The next step is now to see what is causing those RPC latencies, then you’ll have to check the counters like we did using steps I-, II- and III- showing:
- LDAP Read or Search times (network or GC sizing)
- CPU issue (sizing)
- Disk latency (sizing)
- Memory issue (sizing or leak)
- Network errors (NIC configuration or hardware issue)
- Virus scan queue length
For the thresholds of the above counters, check the following link :


